
In the previous chapter, we looked at the relationships among win rate, R/R ratio, and profitability when trading The RST Way using binomial process trading. However, several other factors are also important to trader profitability. For example, having a high win rate at a particular R/R ratio is great, but may not be very profitable if you can only find one trade per week with that playbook. Therefore, trade frequency is just as important as win rate and R/R ratio. Also, it may be counterintuitive, but increasing risk can be more profitable, since win sizes are tied to risk via the R/R ratio.
Want the complete trading math framework? This chapter is part of How to Day Trade Like a Rocket Scientist with Binomial Process Trading.
In this chapter, we’ll look at the various factors that impact profitability, how they interact, and how to maximize profitability.
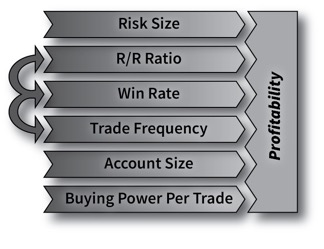
Figure 9.1. Factors That Impact Profitability.
We’ll also look at the variation in profitability that traders can expect. Operating a system with a 75% win rate in the long run does not mean every trade block will have a win rate of 75%. In fact, most trading blocks will have a win rate quite far from 75%, so traders must have the skills to determine whether their trading is on track to hit the desired win rate in the long run or not. Being able to distinguish between bad trading and bad luck is one of the most important lessons in this book.
This variation is why RST traders use large blocks of trades (no fewer than 100 trades) to assess their trading. This provides a statistically significant sample size upon which to make rational judgments of how the system is performing before taking any steps to improve profitability.
Risk Size
Risk size refers to how much you are willing to lose per trade. Under The RST Way, this will be the same amount each trade.
Because win size is linked to the risk size via the R/R ratio, increasing risk can increase win size and profitability. However, as discussed in the previous chapter, increasing risk size too much can lead to certain transaction risks related to buying power limitations and other issues related to the Drawdown Effect. In my experience, a risk size of 1-2% is the sweet spot. This allows you to enter almost every trade you see without compromising the placement of your stop loss. There are no issues with using a risk size of less than 1%; it will simply result in lower income and slower growth.
Account Size
Account size also impacts profitability since win/loss amounts are defined as a percentage of account size. Double the account size, and profitability will match. This is true up to a point where price slippage becomes noticeable. Past that point, the relationship between profitability and share size is no longer linear, but as you are still more profitable.
However, there will be a point where your share size (tens of thousands of shares, depending on stock price and trade volume) will start to make its own waves in the market. Instead of trying to ride the momentum, you are creating it yourself. The candlestick pattern you are trying to take advantage of is never going to play out because your own trade will wipe it out. It’s like trying to surf a 10-foot wave with an oil tanker. Instead of going for a ride, you will wipe it out.
There is a limited number of shares available at the best bid and ask prices. As an enormous order eats through the order book, the average price per share gets worse. The trade itself is effectively widening the bid-ask spread, which can be a significant problem. This is why you can’t day trade to a billion dollars and why billionaires don’t day trade. As I mentioned earlier in the book, institutional and retail traders are two distinct types of traders swimming in the same waters, but with very different means of survival.
Buying Power
In the previous chapter, we discussed certain transaction risks related to buying power limitations. If your trading style involves placing the stop loss very close to the entry, you may find yourself using most – if not all – of your buying power on each trade, which could limit the number of trades you can take simultaneously and adversely impact your profitability.
Of course, this is a trade-off each trader must evaluate for themselves. If you are profitable “enough” with the aggressive scalps using one trade at a time, then maybe that is the best option for you. Even though it is only one trade at a time, those types of trades will complete faster, thus allowing the next trade to start sooner.
Trade Frequency
With all else being equal, the more trades you take, the more money you can make. However, increasing trade frequency too much could mean bending the rules of your trade playbook, which will negatively impact your win rate. That is not necessarily a bad thing; the increased trade frequency and lower win rate may overall be more profitable. It is something you will need to pay attention to when reviewing your trading blocks.
Risk/Reward Ratio
Because BPT is synonymous with “fixed R/R ratio trading,” the R/R ratio you choose sets the stage for your entire trading system under The RST Way.
When first learning to day trade in simulator, I recommend all new traders start with an R/R ratio of 1/1. It makes it easier to understand The RST Way of trading while getting up to speed. If you are profitable there, then you may never have to change it. Changing the R/R ratio is like learning a new system- it impacts the types of stocks you trade and when you trade them. Types of trades that benefit from more extreme R/R ratios (such as 1/3 or 1/4) would include opening range breakouts and highly volatile stocks.
Once you get used to trading The RST Way, you may want to use different R/R ratios for different types of trades and playbooks. This means you are trading with two independent systems, and they should be tracked separately. Trading two systems like this is a good way to increase trade frequency and profitability without wrecking the original system.
For example, you may want to have a system with R/R ratio of 1/2 or 1/3 while trading ORBs at the market open. Then, 15-30 minutes after the open, you could transition into using a system based on the R/R ratio of 1/1 or 1/2 for ABCD patterns. Midday, you could use a third system for reversals, and so on. When it comes to trade blocks and managing trades, each system should be handled separately.
Win Rate
When trading at random (picking long or short on any stock at any time) under The RST Way, the win rate will be exactly what is required for breakeven at the chosen R/R ratio, thanks to BPT. At an R/R ratio of 1/1, the win rate will be 50%; at an R/R ratio of 1/2, it will be 33%, and so on.
When replacing random trading with human decision-making, the best-case scenario is that the win rate improves enough to cover commissions and fees, and the system becomes profitable. As we showed in the previous chapter, this only needs to be a few percentage points above breakeven.
It may be counterintuitive at first, but the next best scenario is a really bad win rate. Having a win rate of 25% at R/R ratio of 1/1 is horribly unprofitable, but all you have to do to become obscenely rich is invert when you go long and short. Just turn your monitor upside down, and you will instantly become a 75% win rate trader at a 1/1 R/R ratio, which is insanely profitable.
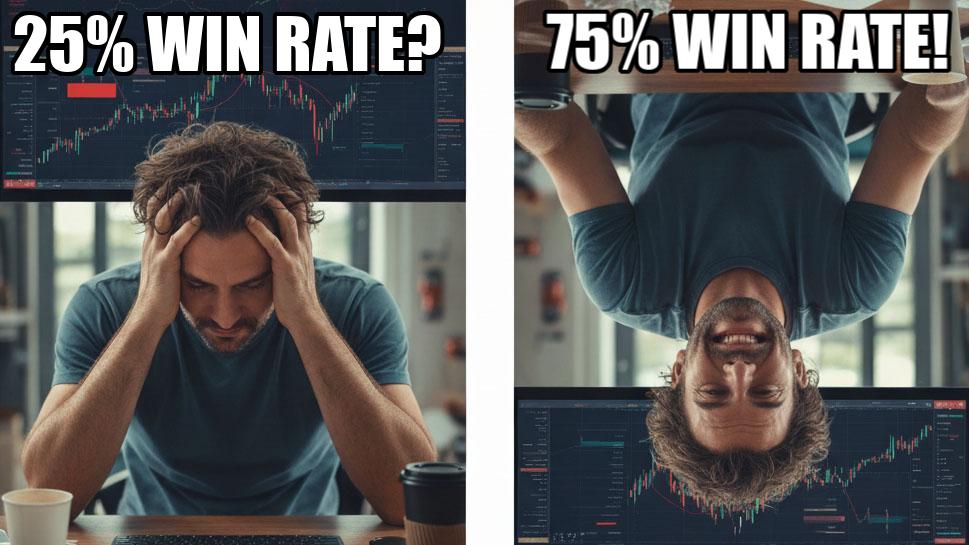
Figure 9.2. 25% win rate? 75% win rate!
The worst-case scenario is that you hover within a few points of breakeven with a flat equity curve similar to trading at random. You will not be profitable, but thanks to The RST Way, you also won’t hemorrhage money, as the research has shown that day traders tend to do; you just need to nudge your win rate up a few points.
The first way to improve your win rate is to be more selective of what trades you take. If you are trading ORB and ABCD patterns, then only trade the best examples of those patterns. If your win rate is suffering and you’re averaging 6 trades per day, try cutting it down to 3.
Another way to improve win rate is to add useful indicators to your playbook. Profitable trading can be done without any indicators; using the entry/exit rules from the Playbook chapter on stocks that gapped overnight due to a recent news event is enough. But if you aim to improve profitability by increasing trade frequency, you may need additional indicators to help maintain your win rate.
These indicators can come from a variety of sources:
- Traditional chart indicators such as VWAP, moving averages, MACD, RSI, etc. (I like VWAP for ABCD as discussed in the Playbook chapter. I don’t use any other chart indicators).
- State-of-the-art indicators based on proprietary data sources and algorithms. This includes sentiment indicators based on news and social media posts.
- Other traders in trading chatrooms and on social media. Trade with (or against) their call-outs. The hive mind can be very powerful.
Anything that can indicate when a stock is overbought or oversold can be used as an edge to improve win rate.
In general, I would keep indicator usage to a minimum, as it adds complexity to the system and makes diagnosis and improvement more difficult because more variables are involved. So, if you must use indicators, I would suggest using them primarily to find trades rather than to time entries. The former is much easier to decouple from the system for diagnostics purposes.
Another way to improve the win rate is to trade different types of stocks. If you’re trading the typical day trader meme stocks, consider these instead:
- High volume, but low volatility. Try trading these on longer time frames. This is essentially trading the market/sector instead of the stock.
- In that same vein, trade ETFs and indexes like SPY instead of individual tickers.
- Try penny stocks. This has its own risks and benefits, which are beyond the scope of this book, so be sure to do your homework first.
Finally, trading different timeframes can impact win rate. If you are struggling with 1m and 5m candles, try 10m, 15m, or longer. Each timescale is like a mini-game in its own right, much like chess. Different time controls in chess (bullet, blitz, rapid, classical) influence players’ strategies, and the same is true for trading. Some traders excel with 1-minute or even 30-second candles and have average trade durations of just a few minutes, while others achieve better win rates and profitability by using 5- or 10-minute candles for trades that take 30-60 minutes or longer to conclude.
Expected Variation in Results
Having a win rate of 75% does not mean you will always win 75% of your trades. Some days/weeks/months will be better than others. This variation in performance is natural and unavoidable (mathematical certainty).
Being able to distinguish between bad trading and bad luck is crucial to being a successful trader. If you can’t tell the difference, you might end up making ruinous changes to what was actually a million-dollar system. We will discuss this in detail later in the chapter, explaining how to distinguish between bad trading and bad luck.
Profitable trading is not about trying to win each trade- it’s about how you manage your trading as a whole.
On the book’s website, you can find a simple program I created called “TAGS” (Trade Account Growth Simulator). You can use the program to simulate trader equity curves based on win rate, R/R ratio, trade frequency, and other factors.
These are very realistic representations of RST trader equity curves, thanks to binomial-process trading, which ensures the curves follow a predictable pattern due to controlled win/loss amounts.
The most important takeaway from the simulations is the significant variation you see run to run. Sure, if you assume a win rate of 99% with an R/R ratio of 1/10, the curves always go to the moon. But with more down-to-earth parameters, such as a 60% win rate at R/R ratio of 1/1, you can get a more realistic view of what can happen day to day, week to week, or month to month.
It is crucial for day traders to familiarize themselves with this variation so they do not inadvertently blow up a million-dollar playbook. It is entirely possible for a system that generates 7 figures per year to have a month that loses money. The nightmare scenario is that the trader alters the system in response to the temporary downtrend and ends up with a fundamentally inferior system that is no longer profitable.
Take a look at Figure 9.3. These are 9 possible equity curves for a month of trading for a trader with a 60% win rate at an R/R ratio of 1/1. That win rate and R/R ratio are very profitable, but there will occasionally be red weeks and even months. There are no red months shown in Figure 9.3, but there are a few cases where periods of 2-3 weeks were flat or red, and months that were barely over breakeven. It’s important for the trader to recognize when their trading is within expectations.
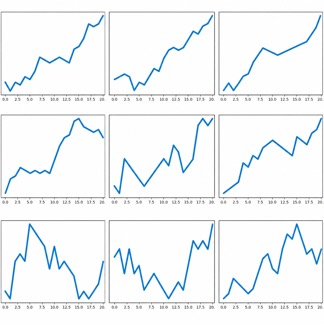
Figure 9.3. Simulated equity curves for trader with 60% win rate at R/R ratio of 1/1 (20 trading days, 5 trades per day).
Overreacting to every trade and constantly tweaking strategies is the downfall of many day traders. They never give their systems a chance and become permanently stuck in “no man’s land”. Real growth only happens when a system is given the necessary time to demonstrate its value (or lack thereof). If the system is changed every time there is a downturn, then the system is essentially on a random walk and will either oscillate around breakeven forever (under BPT) or catastrophically end in bankruptcy (traditional day trading approaches with uncontrolled win/loss amounts).
The Binomial Distribution
The equity curves for RST traders can be easily simulated thanks to binomial process trading, which is directly modeled by the binomial distribution.
The binomial distribution describes how many wins and losses can be expected out of a number of trades. “Binomial” means “2 terms,” so the binomial distribution is used to analyze events with two possible outcomes: pass or fail, rain or dry, heads or tails, and so on. Trading can only be modeled by the binomial distribution if “a win is a win” and “a loss is a loss”. This is true for RST trading, which uses BPT, but not for other traders, whose win and loss amounts are not controlled.
Figure 9.4 shows the binomial distribution probability mass function, which determines the likelihood of any given outcome. For example, to calculate the likelihood of getting 5 heads out of ten coin flips: n=10, x=5, and p=0.5. P(x, p, n) in this case would be 24.6%.
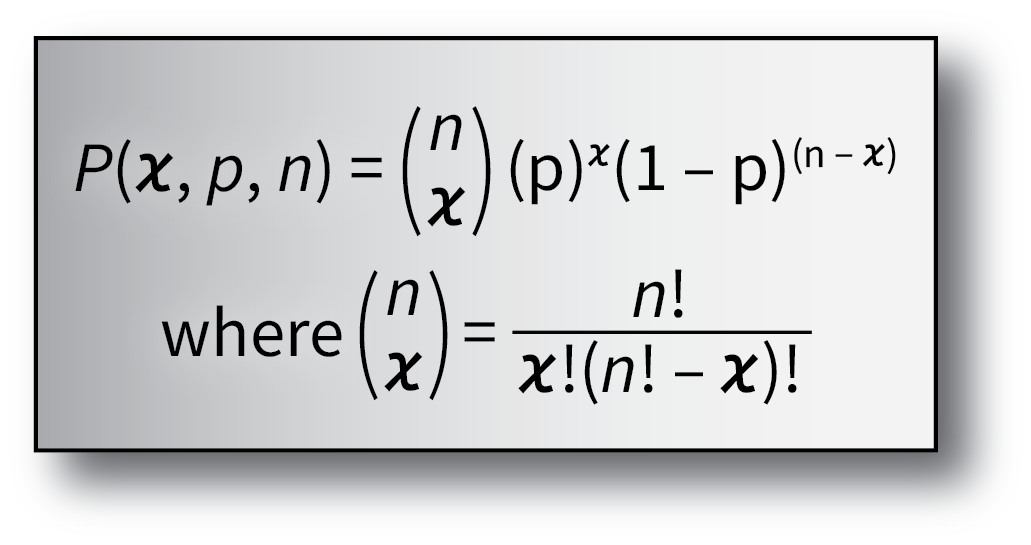
Figure 9.4. Binomial distribution probability mass function. P is probability of observing x successes in n trials, with the probability of success on a single trial denoted by p.
Table 9.1 gives the probability distribution for the 10-flip coin experiment. Figure 9.5 is the same information in bar chart form. If you keep repeating the 10-flip experiment over and over, you can expect those 10-flip experiments to follow this probability distribution. In other words, about one out of a thousand experiments will be all heads (or no heads), about one in ten will have 3 or 7 heads, and the most likely outcome is 5 heads, which occurs about 25% of the time.
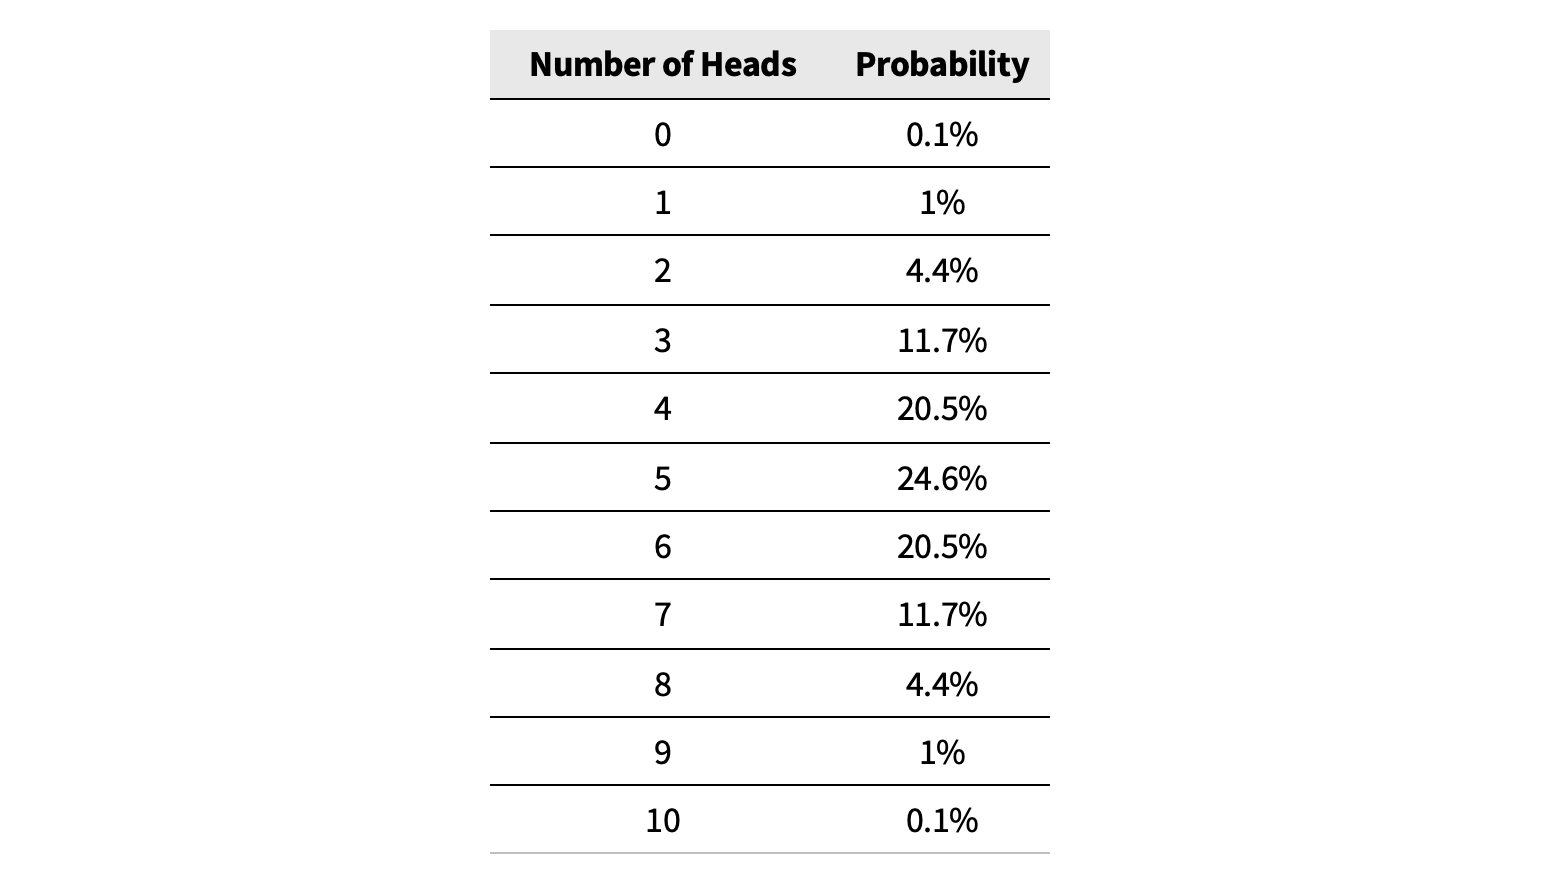
Table 9.1. Probability of X heads out of ten coin flips.
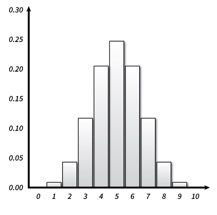
Figure 9.5. Binomial distribution for 10 coin flips.
Notice that the most likely outcome, 5 out of 10 heads, occurs less than 25% of the time. This means that even though you may achieve a 50% win rate as a trader, day to day or week to week, you’re likely to see anything but 50% wins. It is essential to keep this in mind to avoid overreacting to fluctuations in your results.
Consider Trader Joe, who has the following characteristics:
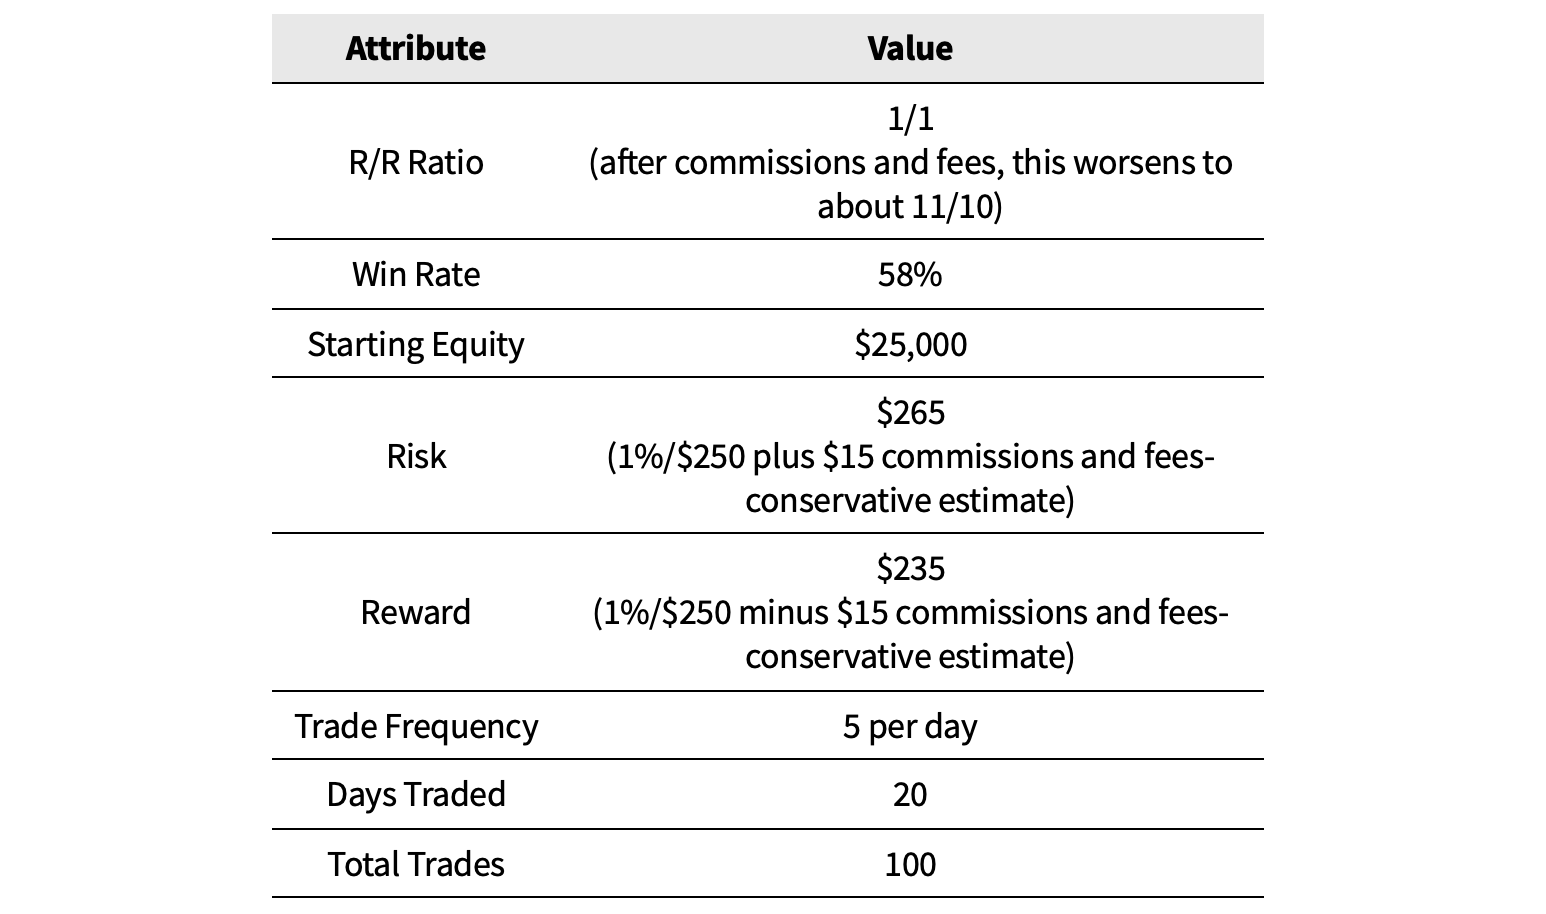
Table 9.2. Trader Joe’s stats.
The binomial distribution for blocks of 100 trades with Joe’s 58% win rate looks like Figure 9.6:
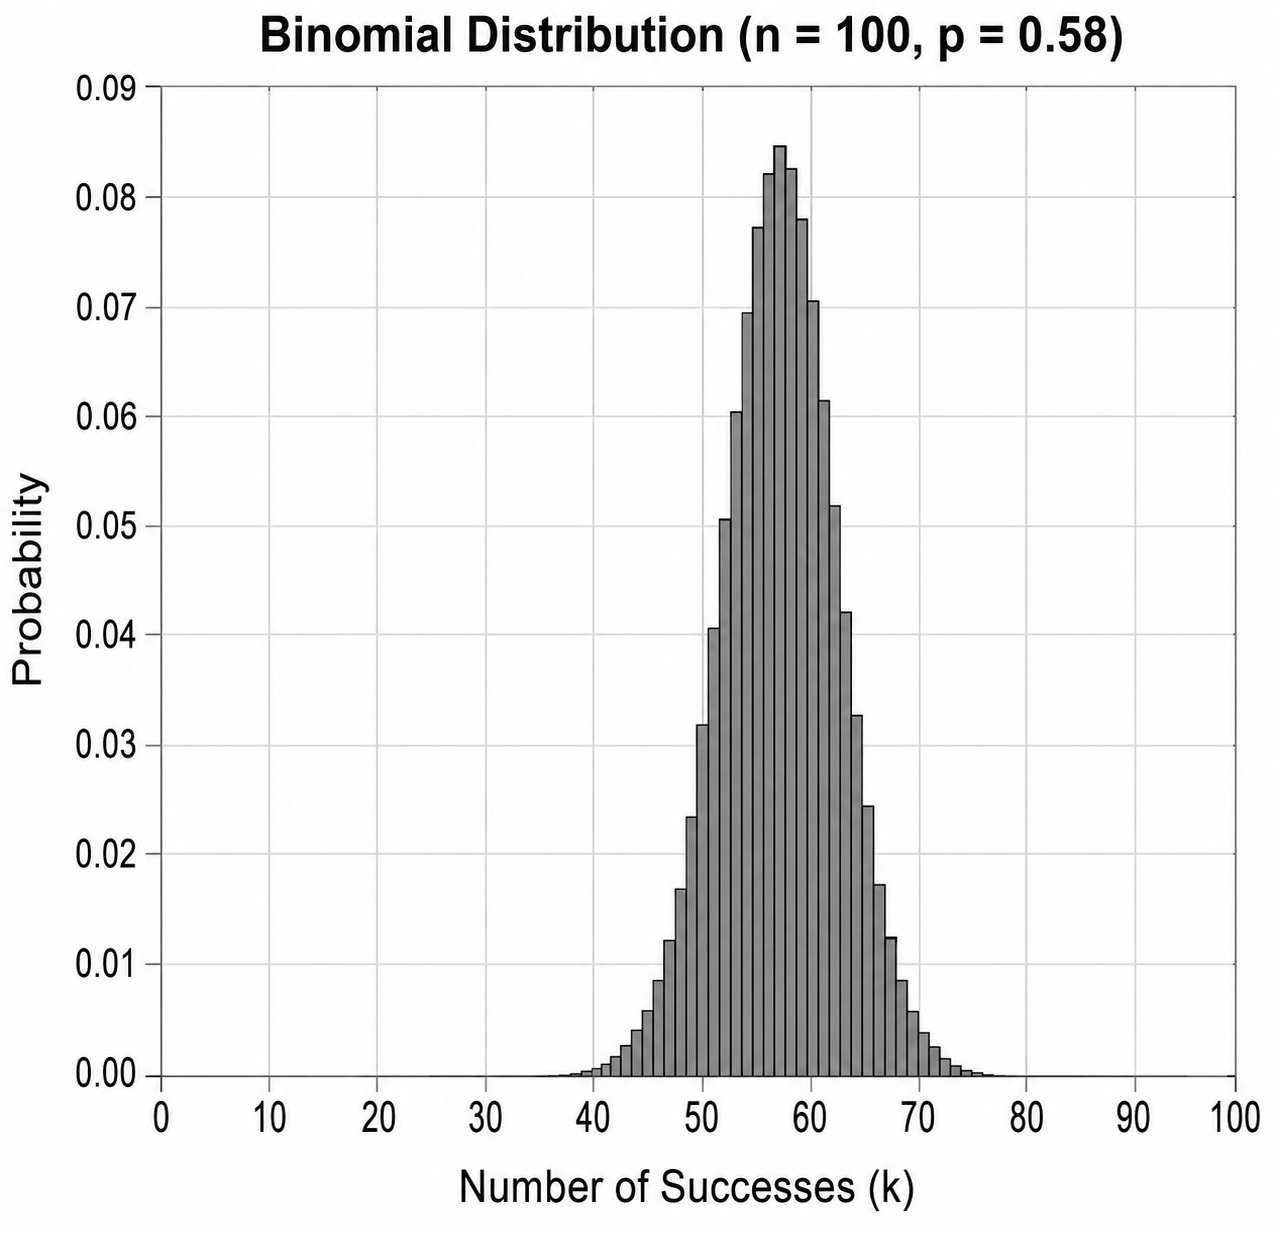
Figure 9.6. Binomial distribution for 100 trades with 58% win rate.
With a 58% win rate, the expected number of wins (i.e., most likely result) is 58. This means if you repeat the 100-trade experiment (one month of trades in this case) over and over, half of them would have more than 58 wins, and half would have fewer.
For an R/R ratio of 11/10, the minimum win rate for breakeven is 52.4%. So a month needs to have 53 out of 100 wins to be profitable. If we add up all the probabilities in the chart for 53 wins or greater, the total comes to 86.7%.
This means about one out of seven months for this trader will actually be red. Having a red month once or twice per year may sound awful, but it may not be as bad as you think. Table 9.3 includes ten full years of simulated results for Trader Joe:
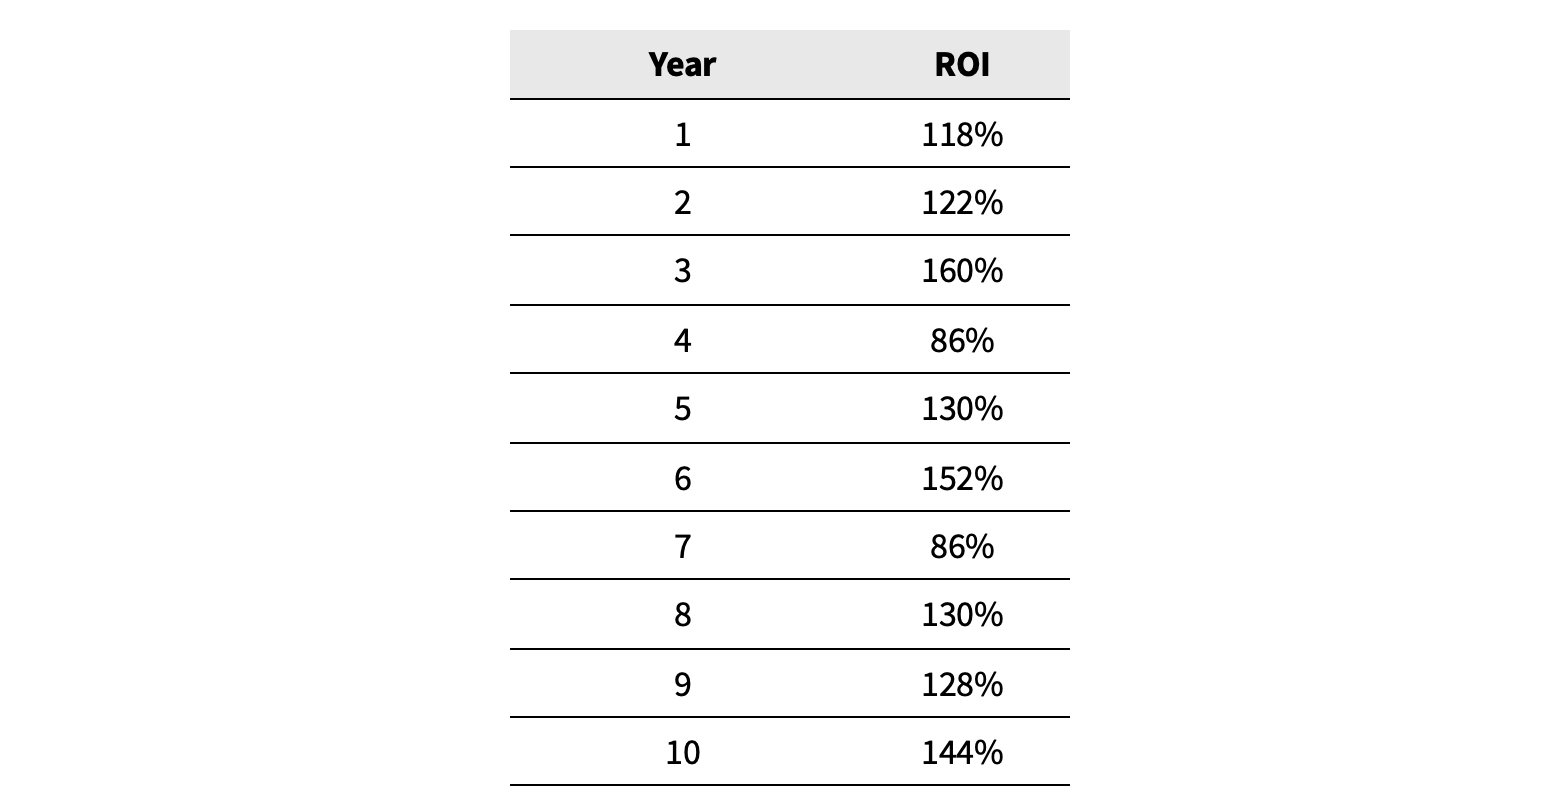
Table 9.3. Ten years of Trader Joe’s ROI.
The occasional red month doesn’t look too bad anymore, does it? Also note that the ROI ranges from 86% to 160%. That’s a 2x difference for the exact same system. Wouldn’t it be a shame if the trader overreacted to a down month by modifying the system and inadvertently ruined it? In the next sections, we will further discuss how to distinguish between bad luck and bad trading, and how to make responsible changes to the system to improve profitability.
Trade Blocks and The Trade Review Process
One of the greatest benefits of The RST Way is its simplicity. For RST traders, a trade is defined by:
- Entry
- Stop Loss
- R/R ratio
Which means they do not have to worry about:
- Exit price
- Partial size
- Partial frequency
- Averaging down/up
- Exiting for breakeven
- Indicators and other rules for entry/exit
- Share size (this is automated for RST traders and identical for every trade)
This makes it much more straightforward to distinguish between bad trading and bad luck with The RST Way. Other traders are forced to constantly second-guess which element(s) of their convoluted trading are holding them back. The worst part is that they could have exited earlier or later on every single trade and made them all winners. It’s very easy to fool oneself during the trade review process in that scenario.
However, for RST traders, the trade review process is very straightforward. It starts by accumulating a statistically significant number of trades, then reviewing those trades in a three-step process shown in Figure 9.7:
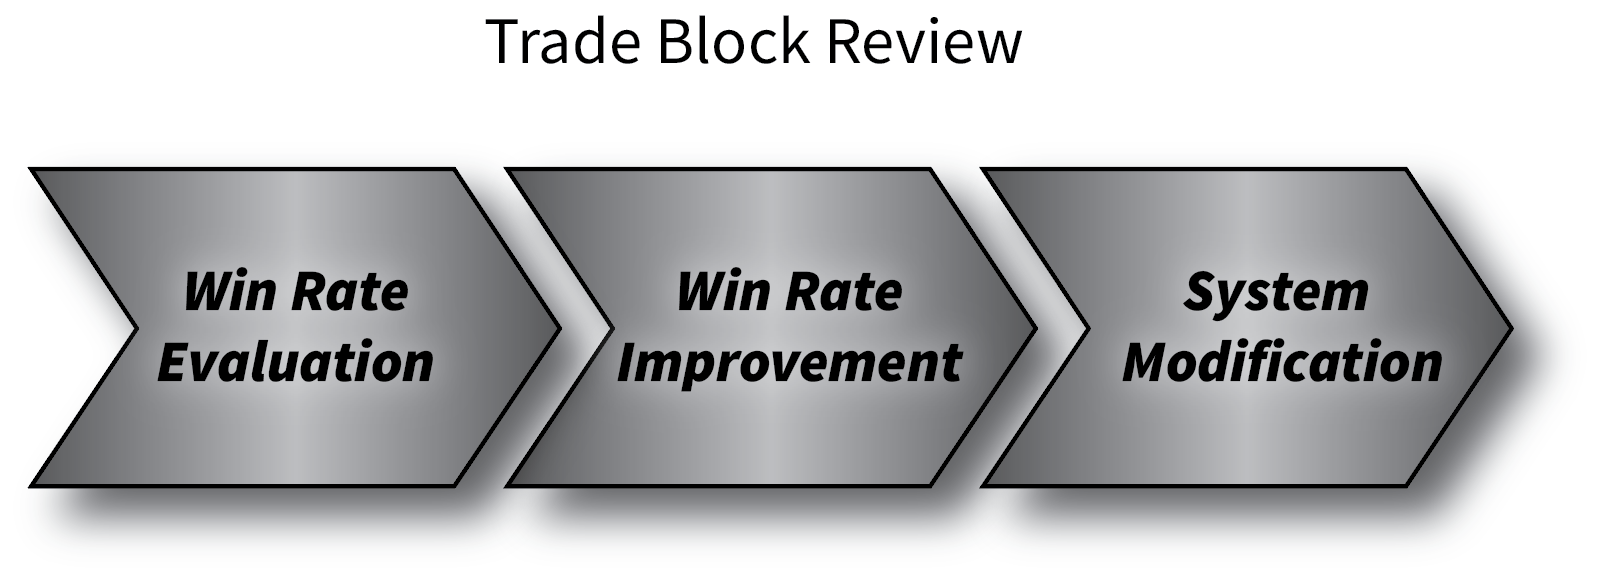
Figure 9.7. Trade block review process.
Win Rate Evaluation
The first step is to make a judgment call about the win rate observed in the trade block. As we’ve shown throughout this chapter, when analyzing a sample of trades, the win rate does not always match the system’s expected win rate.
So, let’s assume your goal is to trade at a 60% or higher win rate with a R/R ratio of 1/1. But your first trading block has only a 52% win rate. Is it bad luck or bad trading? Do you:
- Keep the system intact for the next block
- Blow it up
To answer this, we turn to basic statistics. The question is, how likely (or unlikely) is it that a win rate of 52% comes from a system that actually has a 60% win rate or better?
The answer depends heavily on the number of trades that demonstrated a 52% win rate. If it’s a small number, then the error bars on the analysis will be huge (i.e., the answer will be “maybe it is, maybe it isn’t”). If it were a large number of trades, such as 1,000, it would be extremely clear that the system’s win rate is close to 52%, not 60% or higher. However, completing 1000 trades with a poor win rate before making a change is not a good idea, as you’ll likely go broke before then.
Personally, I think 100 trades is a decent number in most cases. That’s roughly a month’s worth of trading if you are making 5 trades per day for 20 trading days. Mathematically speaking, 100 trades are good enough to give you pretty high confidence (up to about 80% confidence) whether the observed win rate is within 5% of the expected win rate. You can see in Figure 9.8 that twice as many trades are needed to get 90% confidence, but I don’t think that’s necessary. I think 100 trades offer the best combination of confidence level and relative speed.
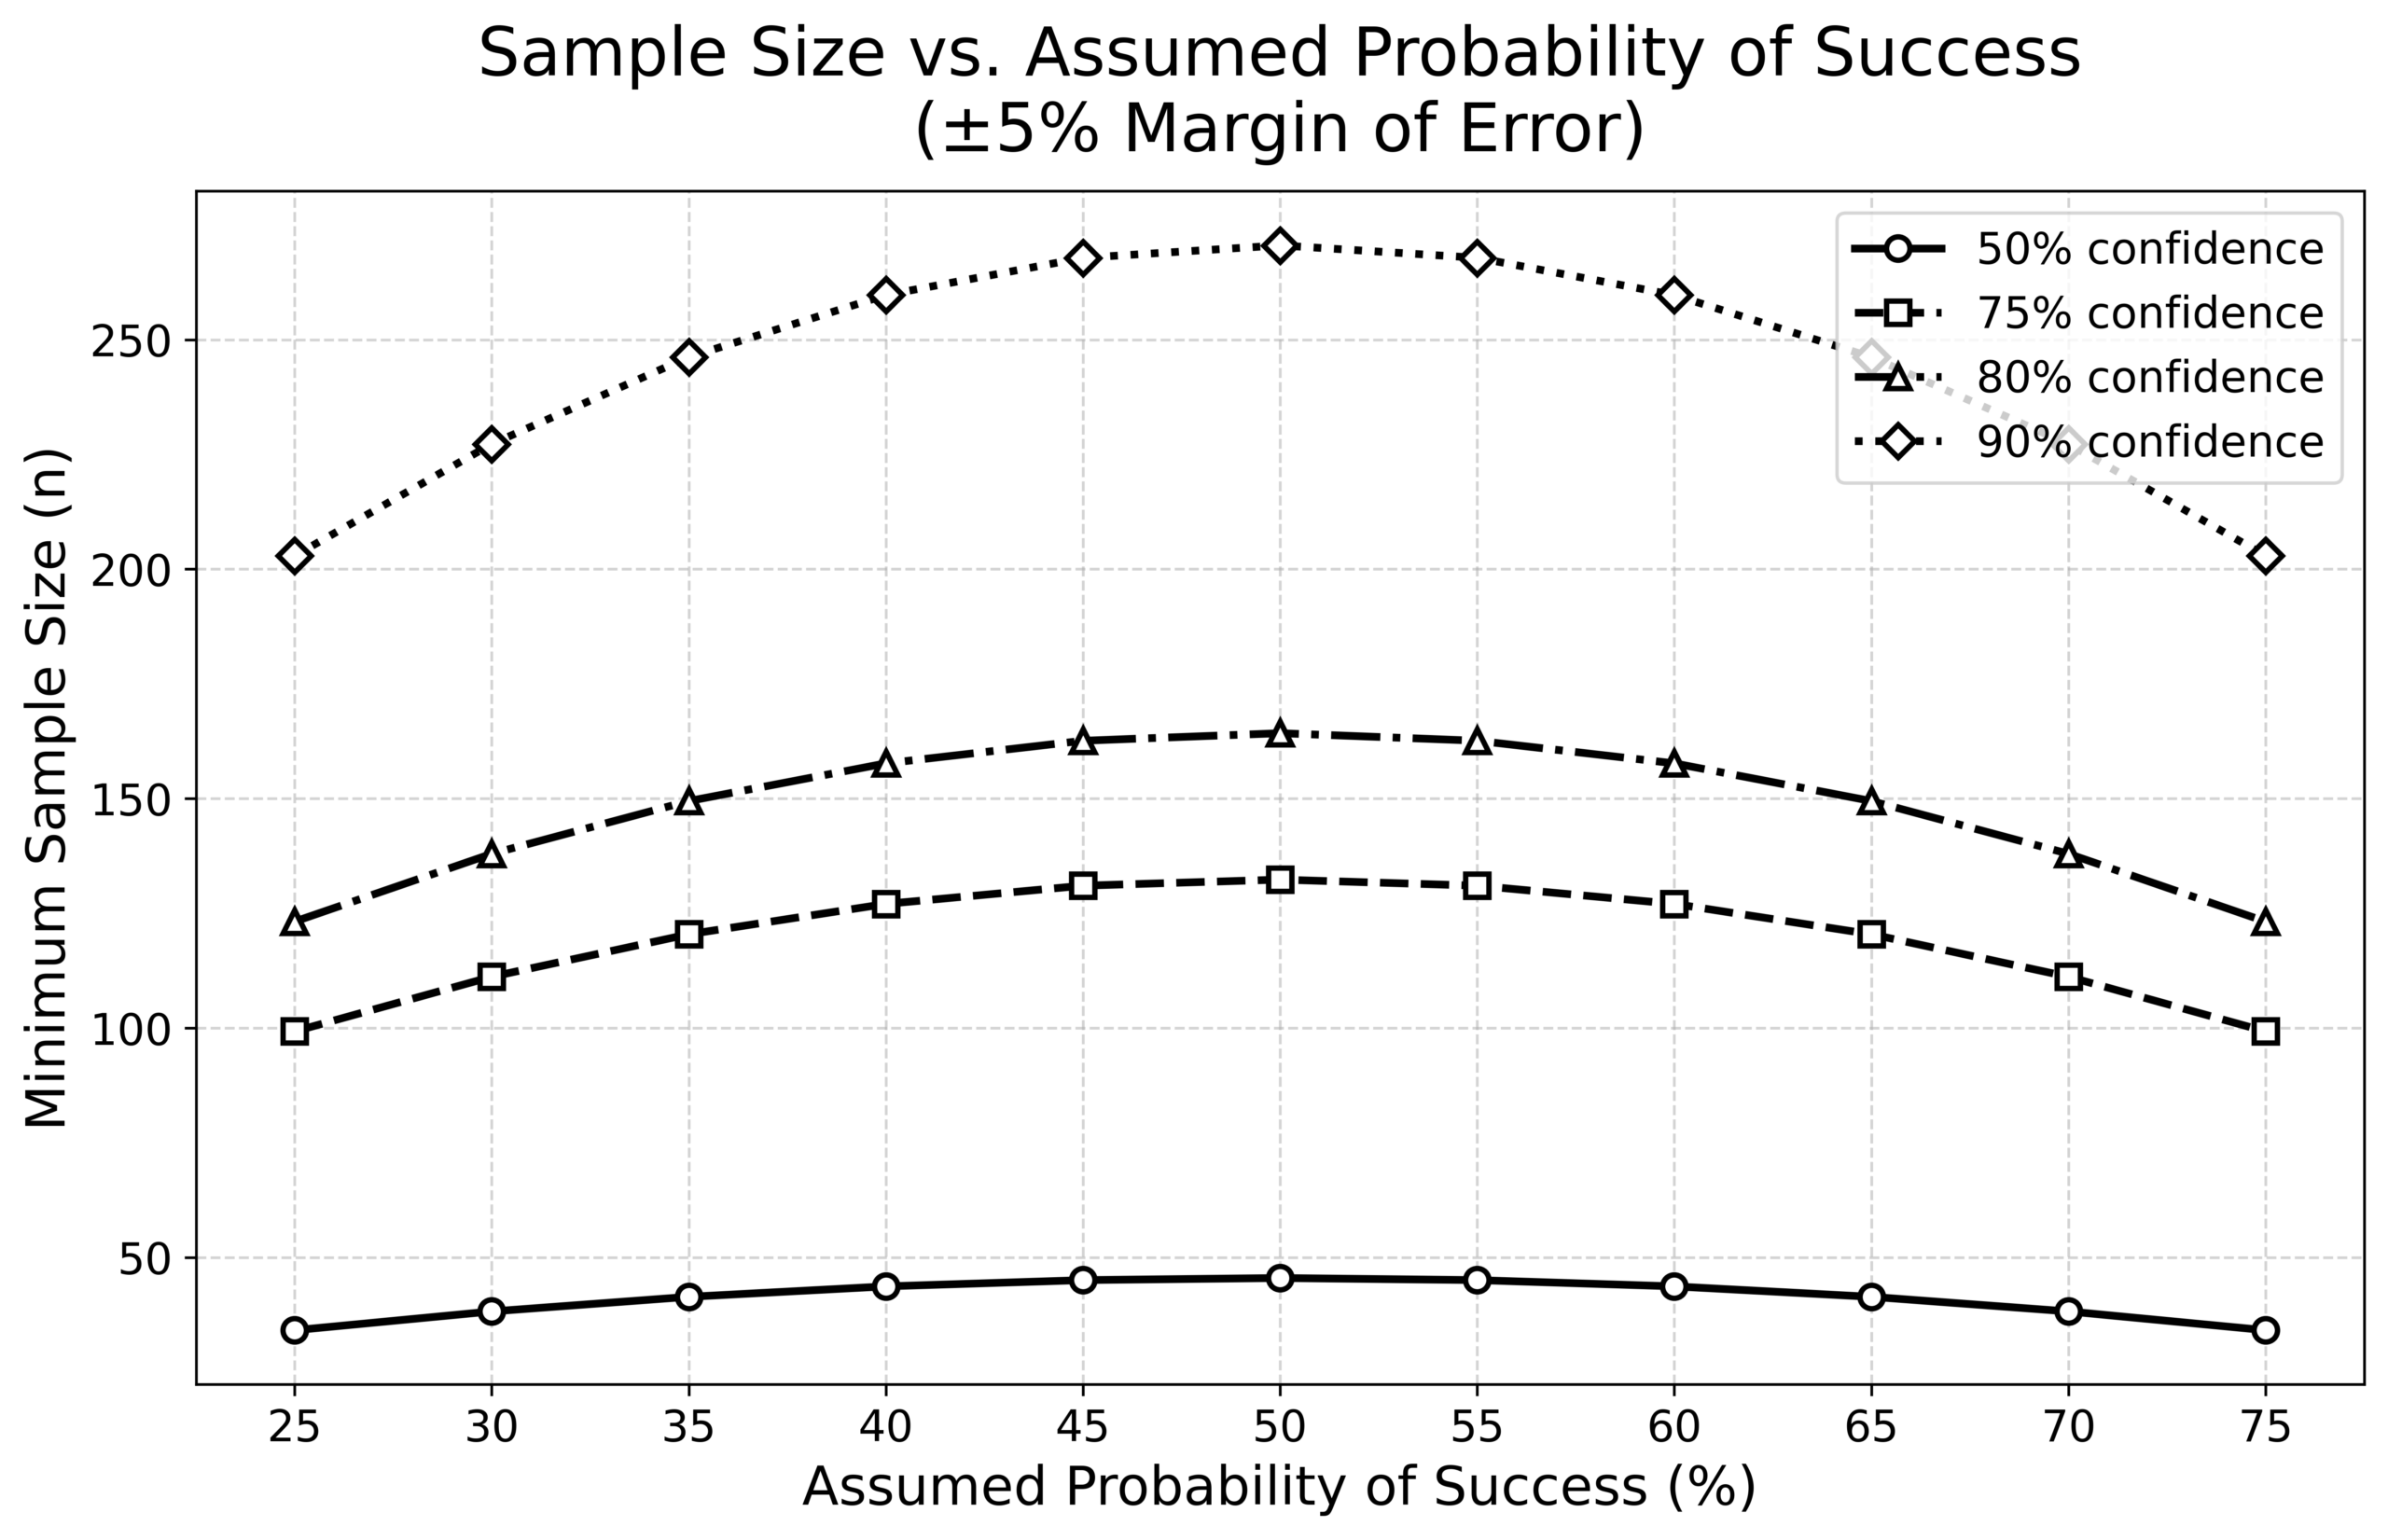
Figure 9.8. Sample size versus assumed probability of success.
So, let’s assume the trade block with a 52% win rate consisted of 100 trades. It is straightforward to calculate the one-sided binomial tail for 52 or fewer wins out of 100, assuming the true win rate is actually 60%. The answer is 6.4% (the Excel formula is “=BINOM.DIST(52,100,0.6,TRUE)”). You should calculate this yourself at the end of each trading block.
That means only 6.4% of 100-trade blocks would have 52 wins or fewer if the true win rate were 60% or higher. A 6.4% likelihood is quite low, so personally, I would be concerned that my trading may not achieve the 60% win-rate target in the long run.
If it were 56 wins (close to the 25th percentile), I would probably not alter the system and try a second block. If the second block’s win rate exceeds 56%, I would consider that encouraging and keep going without altering the system.
However, if the second block is also below 56%, I would take a hard look at my trading and try to figure out why my win rate is suffering.
An RST trader’s #1 job is to determine whether their trade blocks fit the desired win rate distribution. If that is unlikely to be true, then changes need to be made to the system.
Improving the Win Rate
There are three primary ways to improve an RST-based system’s win rate:
- Improved candlestick pattern recognition
- Better-timed entries
- Better stop loss placement
If your win rate is suffering, you can start by first comparing the charts you traded to the pattern descriptions in the Trade Playbook chapter. Perhaps they are not actually good representations of the reference patterns, and too many of your trades involve random market noise rather than genuine movements driven by market demand.
Next, improving entry timing can dramatically improve the win rate. When trading at market open, the patterns described in this book may last only a few seconds. I’d estimate the window size for an optimal entry on a 1-minute ORB trade at the market open to be <10 seconds (depends on stock volatility). I’d put a 5-minute ORB at <30 seconds. ABCD windows are roughly 1-2x longer.
In addition to candlestick pattern recognition and entry price, traders can also consider stop-loss placement.
When RST traders enter a trade, I refer to it as “clawing the trade” because they set the entry, stop-loss, and exit prices for a win all at the same time, which appears as three lines on the chart.
Figure 9.9 illustrates three possible ways of clawing the trade for an R/R ratio of 1/1. The goal for an RST trader is to set the stop loss in the ‘Goldilocks zone’ – not too far and not too close to the price action.
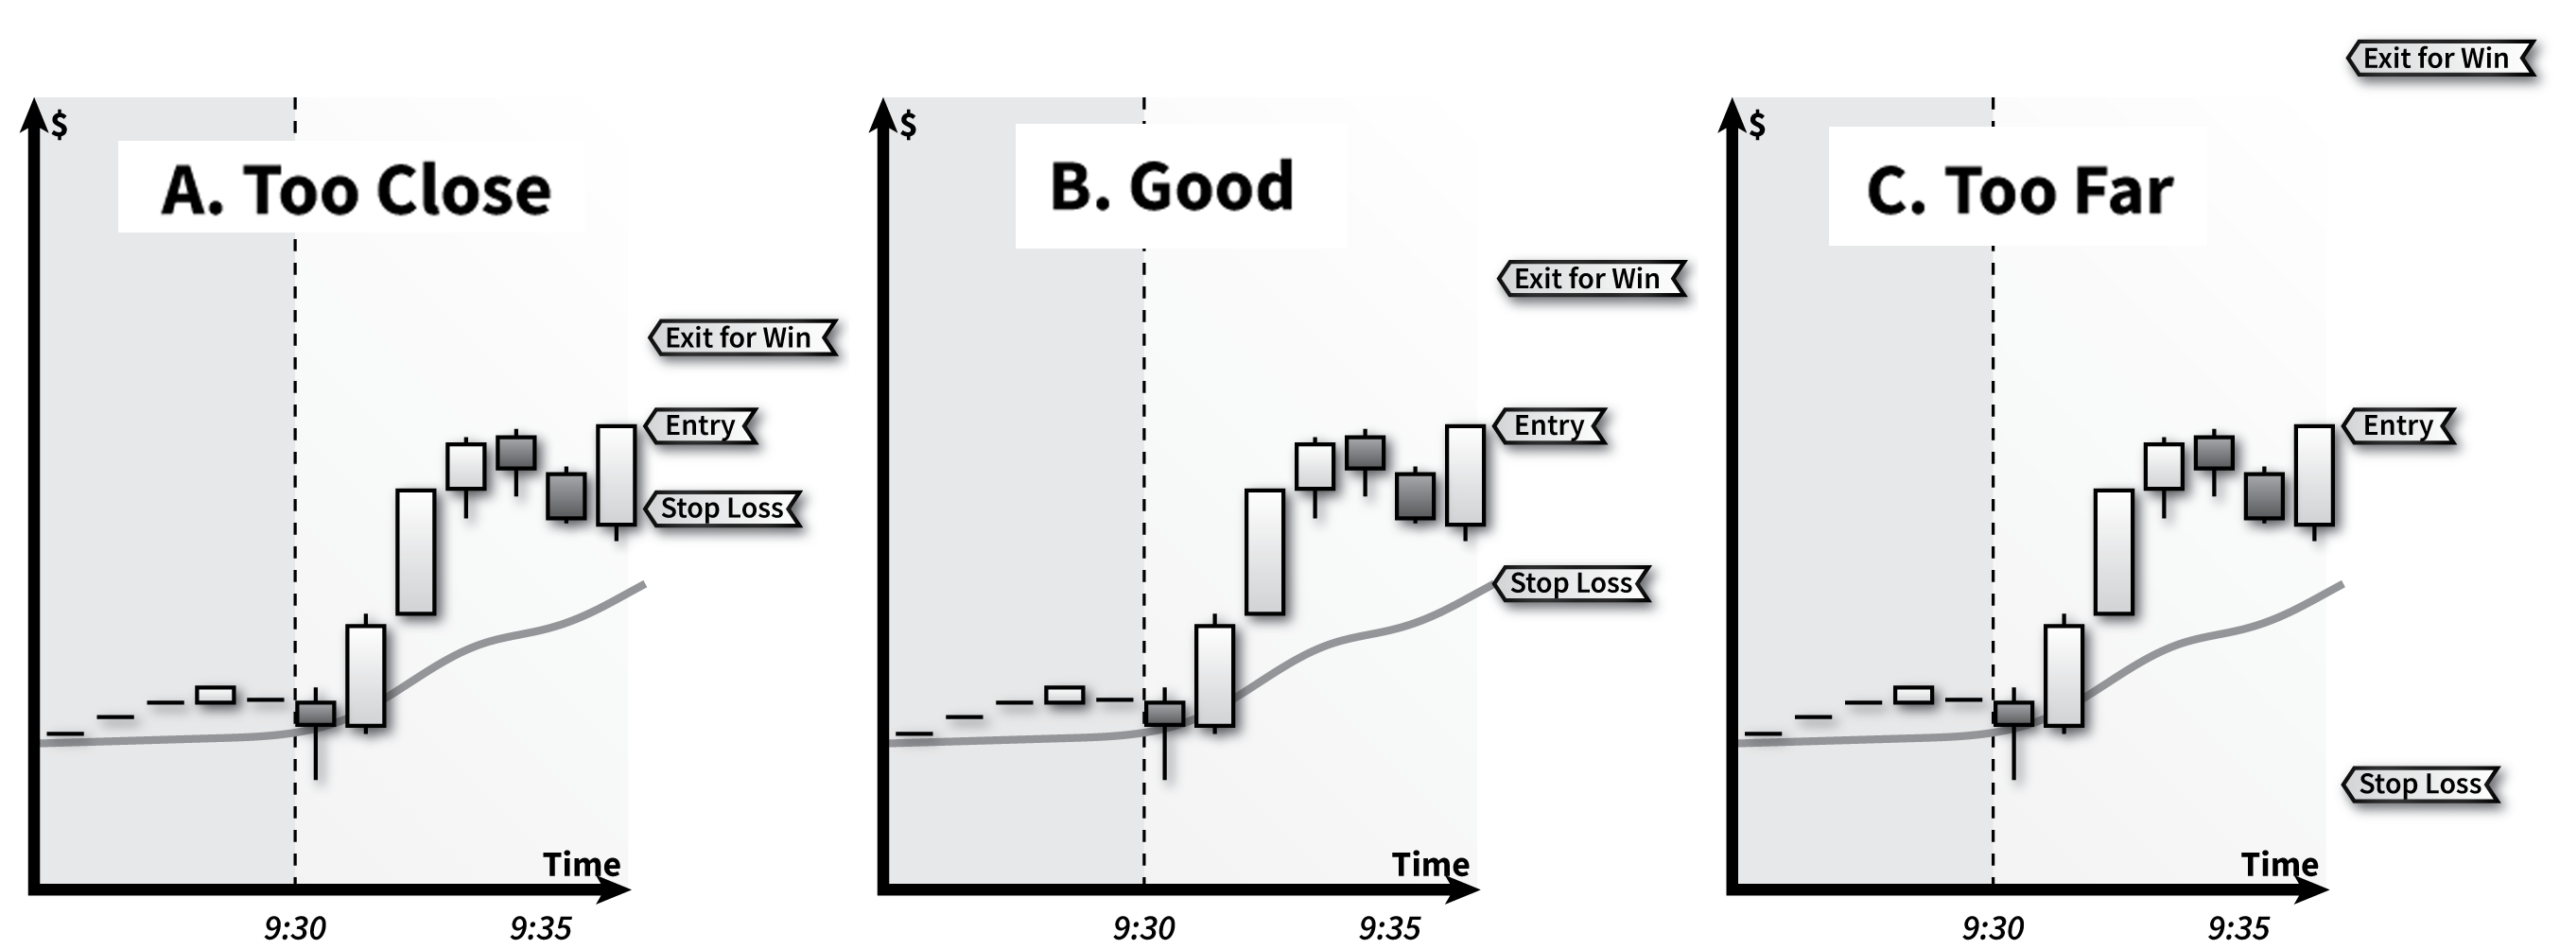
Figure 9.9. Comparison of three stop loss placements.
Chart A shows a stop loss that is too close. In this case, the trade does not have enough room to play out, and you are essentially trading noise rather than the market force the candlestick pattern is designed to capture. Your win rate will be the same as if you were trading randomly (breakeven). Overall, your account will die a long, slow death to commissions and fees.
Chart C shows a stop loss that is too far. Again, this trade is unable to capture the market force identified by the candlestick pattern as it will play out and conclude long before the exit price is reached. This also results in essentially random trading and will ultimately yield a breakeven win rate, leading to a system that slowly bleeds out to commissions and fees.
The fourth option to improve the win rate is to change the R/R ratio. This can also be assessed in hindsight during the trade block review by imagining how the trade would have played out if the exit price for a win had been adjusted to match the new R/R ratio.
If the R/R ratio of 1/1 didn’t work for you, I would first look at 1/2. Then these in order: 1/3, 1/4, 1/1.5, 1/2.5.
At this point, if you have not identified any improvements in candlestick pattern recognition, entries, stop losses, or R/R ratio, I would call upon other RST traders[1] to help review the trades and make suggestions. These conversations should focus on whether the candlesticks were true examples of the reference pattern and whether your stop-loss was placed in the Goldilocks zone.
Optimizing these four components (candlesticks, entries, stop losses, R/R ratio) should, in theory, be enough to produce profitable trading. However, if you are still struggling after 6-8 blocks (no profitable blocks), there are three more options:
- Different types of stocks
- Different time scales
- Different time of day
Unfortunately, these cannot be analyzed in hindsight and require completing new trade blocks to determine if these changes have a positive impact on profitability.
If you’ve been trading only the most popular and highest volume stocks that are discussed in chatrooms and CNBC every day, then you may want to switch to trading only stocks gapping overnight on new news. Do not be afraid to trade a ticker you’ve never heard of before. Day traders routinely trade tickers that are completely foreign to them; companies whose names they do not even know.
Or perhaps you notice that most stocks you trade are between $50 and $100. Try focusing on stocks outside of this range. All stocks and sectors have their own personalities, and stock prices exhibit distinct behaviors. It’s possible that simply fishing in a different pond can turn your trading around.
Also, you can try trading on a different time scale. ABCD patterns that appear on 1-minute candles may not appear on 5-minute candles, and vice versa. Perhaps the solution for your suboptimal win rate is to not change a thing and simply trade with 5-minute candles instead of 1-minute (or even longer).
Finally, you could also try trading at different times of the day. However, that will require different candlestick patterns than the ones discussed in this book. The market open, midday, and market close are all distinct periods of the day with their own characteristics. Day traders love the open for its volatility and stronger market moves, but some (very small minority) also trade other parts of the day, including pre-market and after-hours. I would strongly advise continuing to work on your market open system rather than switching to other times of the day. If you have time, you could trade three systems (or more) at once to experiment with what might work best for you. A 1/1 system at market open with ORBs and ABCDs, a 1/4 system midday with reversals, and so on.
Increasing Trader Income
The ROI in Table 9.3 for Trader Joe ranged from 86% to 160%. For his $25,000 account, that’s $21,500 to $40,000 in profit per year. That’s useful cash but not enough to make you wealthy.
Joe has a few ways to increase income:
- Increase account size
- Increase risk size
- Increase trade frequency
- Improve win rate
For Joe, the obvious first step is to grow his account. If he retains the profits in the account, in a couple of years, he could be trading with a $100,000 account, and his income will quadruple to approximately $100,000/year. Price slippage will not be noticeable at that size.
1% risk is also on the low end. He could switch to 2% risk and double his income. Yes, he may run into the occasional trade being rejected because his share size exceeded his buying power, but there are ways to combat that, as we discussed earlier. Now his annual income has grown to $200,000.
In the United States, the “top 1%” earn $500,000 or more per year. To get there, Joe will need to double his income one more time. I would not recommend increasing the risk further due to transaction risks, so growing the account again would be my next recommendation. $250,000 is roughly where price slippage becomes noticeable. I say this because, in this case, the 2% risk is $5,000. When the stop-loss is less than $1 from the entry price, the share size will be greater than 5,000 shares. If it’s a cheaper stock or a faster scalp with only $0.25 between the entry and stop loss, then that is 20,000 shares or more. These sorts of share sizes are where price slippage might become noticeable to a trader. One or two extra cents will be required on those trades to reach breakeven and eventually score a winning trade, so the win rate will also suffer by a point or two.
Increasing trade frequency is another option Joe has for improving income. His current playbook is averaging 5 trades per day. He may want to consider adding another playbook to his system- another 5 trades per day with the same level of profitability will, of course, double his income. It will also likely require him to work twice as long (oh no, a two-hour workday instead of one!). For example, if his first playbook is built around ORBs, he could add one for ABCD or reversals, which can be traded after the ORBs at market open. Finally, Joe can work on improving his win rate, but there is only so much that can be done in that regard. If he’s shown to be a 58% trader at an R/R ratio of 1/1, it’s very unlikely he can do much to become a 70-80% win rate trader at that R/R ratio. A more realistic upper limit would be 65%. For me, I would not mess around with the system too much if I were at a 58-62% win rate with an R/R ratio of 1/1. I would be more worried about ruining a profitable system and would look to grow the account and develop additional playbooks.
[1]RST traders are recommended since they understand the process of clawing a trade and managing blocks of trades in a way that is unfamiliar to other traders.
For the technical paper covering the expected-value model, assumptions, and failure modes, see Binomial Process Trading: Technical White Paper.
Read the full book and apply the framework. This chapter is part of How to Day Trade Like a Rocket Scientist with Binomial Process Trading.