
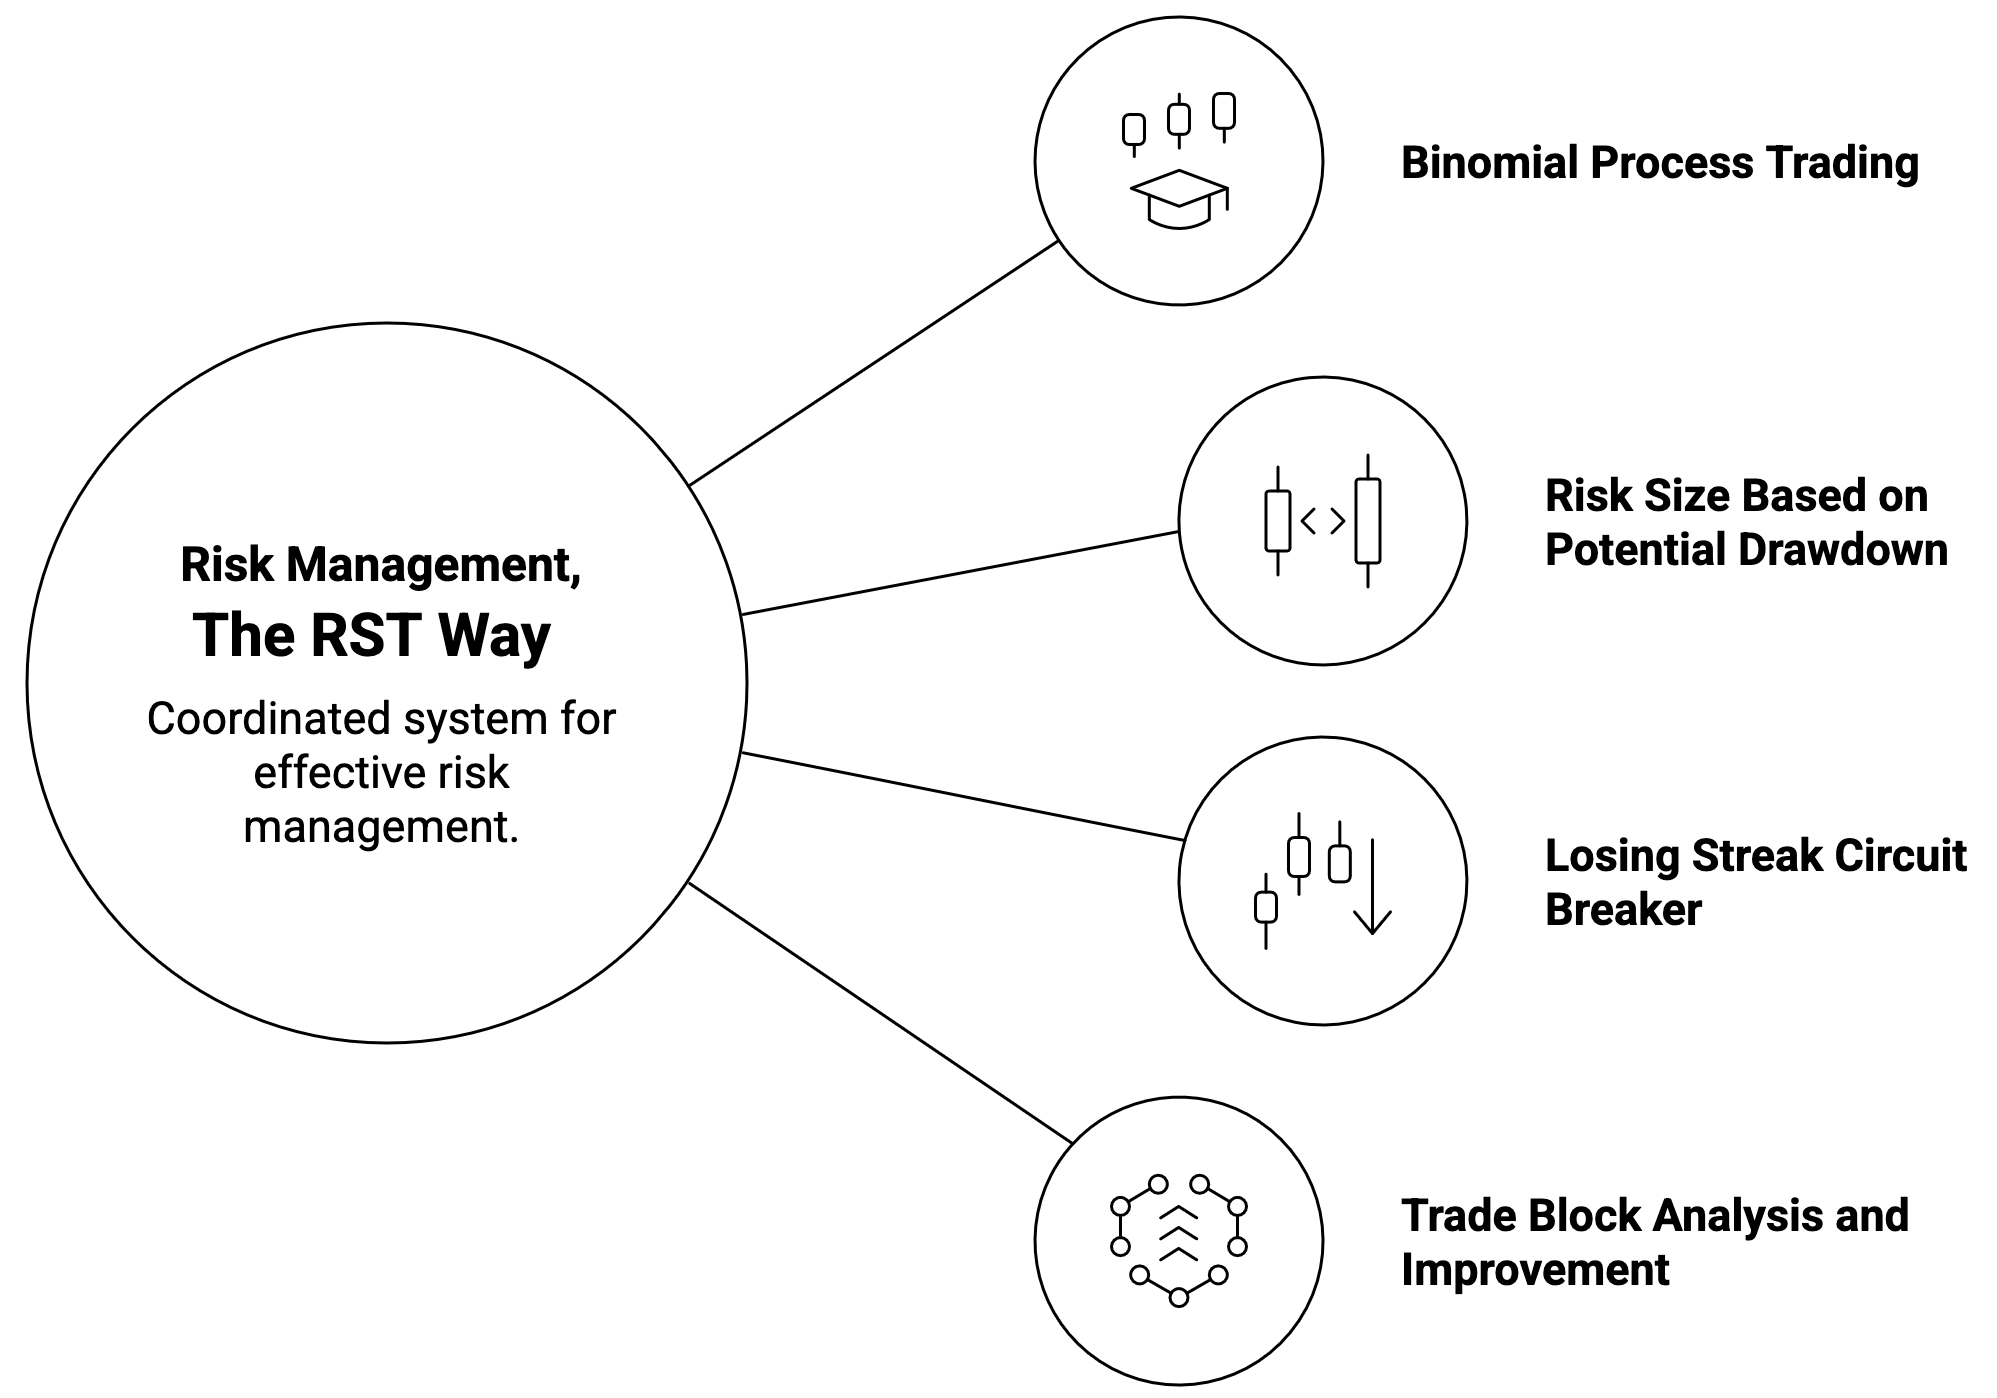
Figure 8.1. Risk Management, The RST Way.
Want the complete framework? This chapter is part of How to Day Trade Like a Rocket Scientist with Binomial Process Trading.
The description of The RST Way of trading in this chapter assumes you are day trading stocks; however, the principles of binomial process trading, the backbone of The RST Way, can apply to other forms of trading, including swing trading, long-term investing, real estate, options, foreign currency, cryptocurrency, sports, commodities, and just about any other form of speculation.
Typical Trading Versus The RST Way
As shown in Table 8.1, RST trading is a very different methodology compared to typical retail trading.
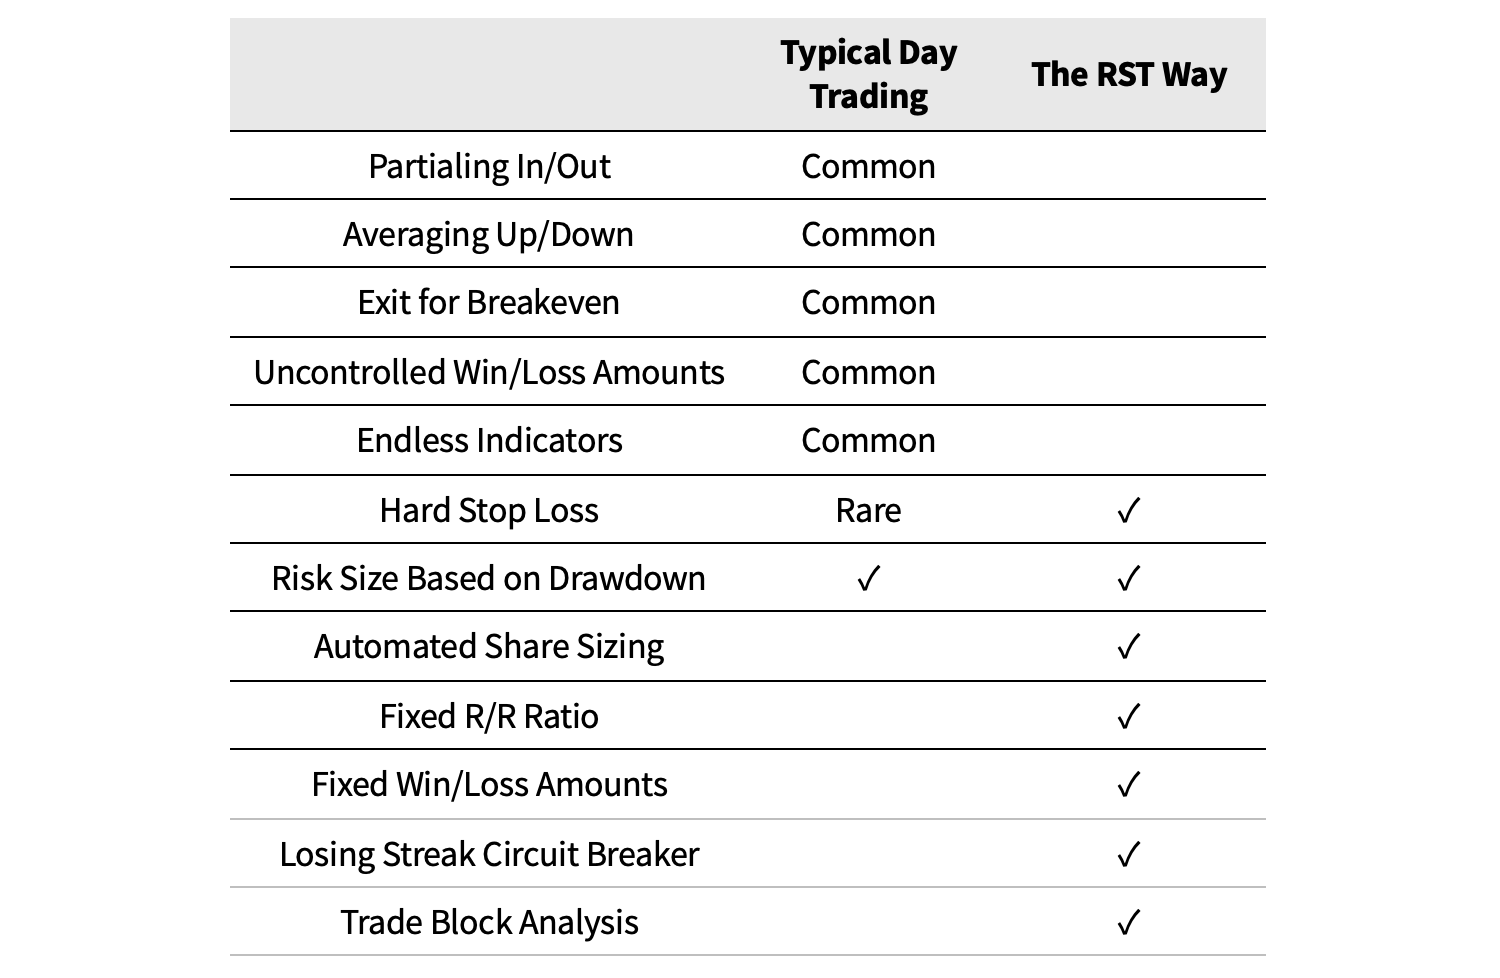
Table 8.1. Typical day trading compared to The RST Way.
The two most critical differences are share size methodology and exit strategy. While RST traders “set it and forget it,” other traders will spend the rest of the trade agonizing over when to exit. Because traders have extreme ADHD and get bored very quickly, they will start adding and removing shares throughout the trade, as shown in Figure 8.2 below.
How do you possibly execute any kind of risk management plan when your trades look like this? With so much going on, how could you possibly diagnose and improve this kind of trading?
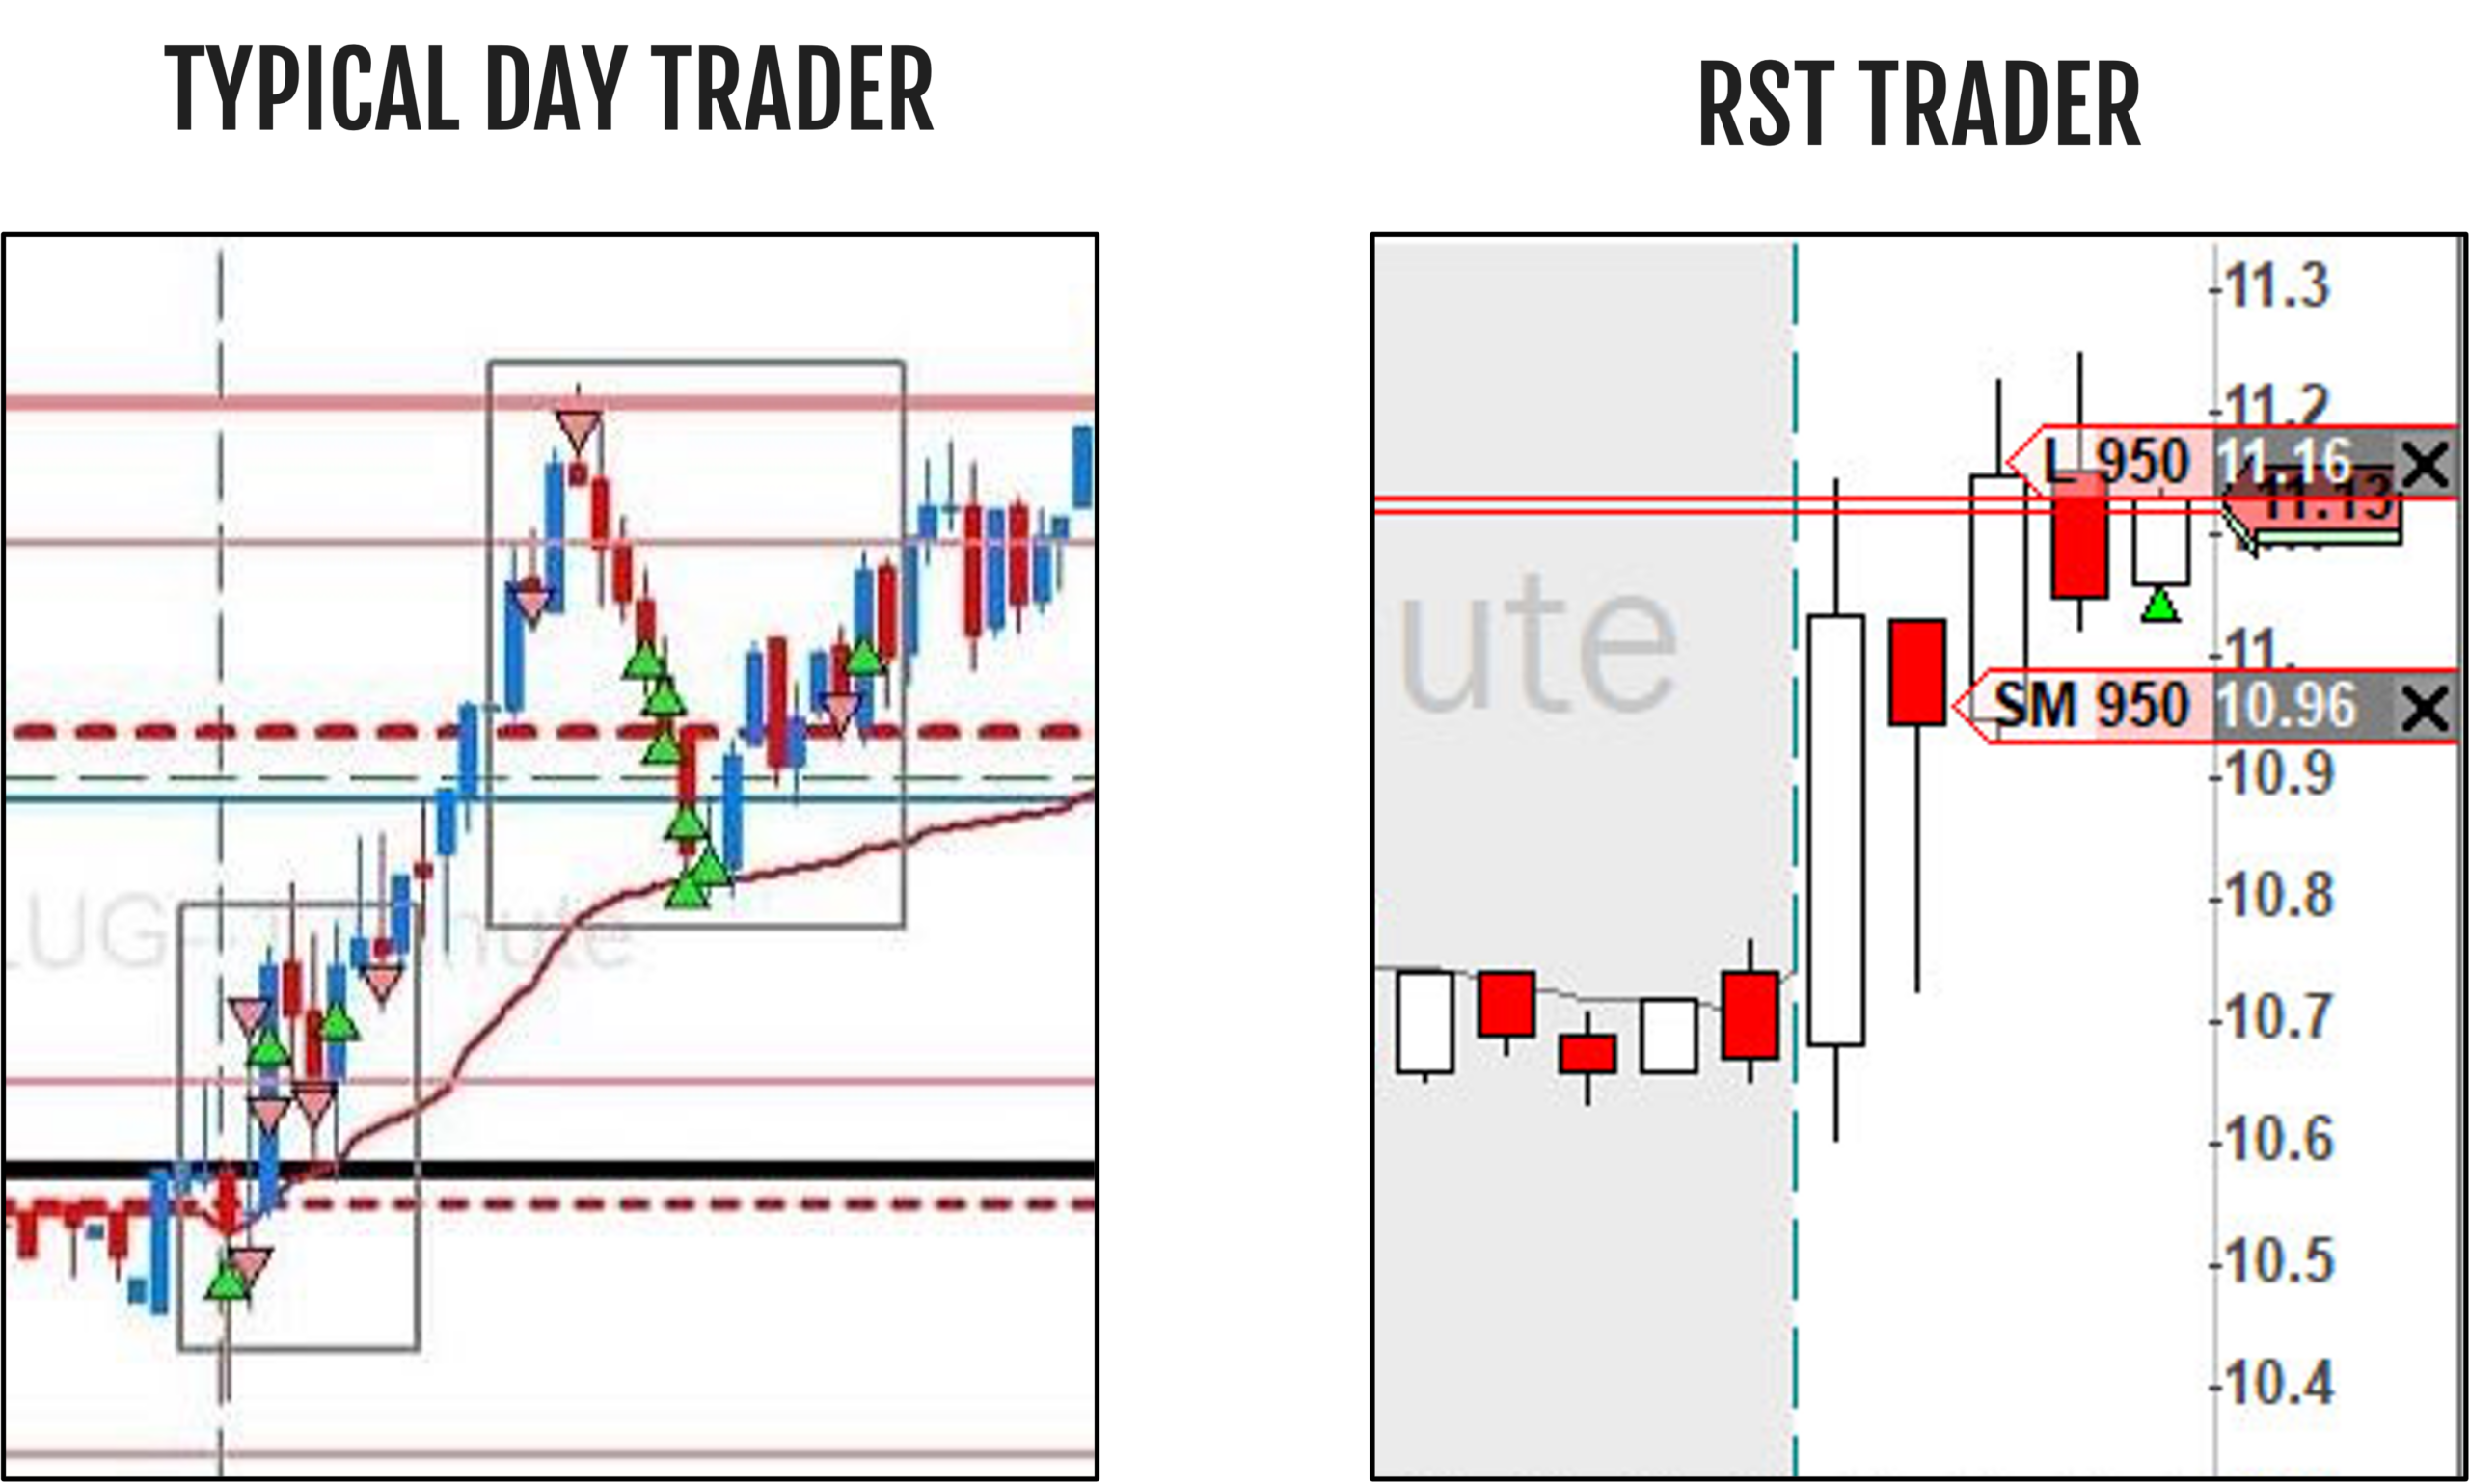
Figure 8.2. Typical day trading versus RST trading.
The two approaches in Figure 8.2 look like completely different activities. You can see that the typical day trader’s chart is plastered with indicators and shows several entries/exits for each trade, while there are no indicators on the RST trader’s chart and only one entry, with two standby orders that will automatically trigger an exit for a win or loss at predetermined exit prices.
The uncontrolled trading most traders use is unprofitable, as confirmed by research studies. When trading this way, you leave yourself vulnerable to all the risks described in the previous chapter. In this chapter, we will discuss The RST Way of trading and how it addresses each of those risks to create much safer and smarter trading.
Binomial Process Trading
The risk management solution that I call The RST Way is based on a fixed R/R ratio and controlled win/loss sizes. I haven’t found other sources describing this method of trading, so I chose to call it “binomial process trading” (BPT).
Aliases for “The RST Way”:
- Binomial process trading
- Fixed R/R ratio trading
- Fixed win/loss amount trading
- One-button trading
- Set it and forget it trading
The primary component of BPT is controlled win/loss sizes. This means controlling (ideally, automating) the share size so you dictate the precise win and loss amounts. Consider Figure 8.3 below. When other traders get into a trade, they don’t have a clue when they are going to exit. The price at which they exit is a convoluted mess of price action, market momentum, and trader psychology. However, RST traders always know the exact exit price when they enter the trade. The entry price, exit price for a loss, and exit price for a win are all defined at the same time.
By treating each trade as a binary event with fixed outcomes, traders can apply statistical models to assess performance, manage risk, and make informed decisions. This dictates share size, risk amount, trade review, and our approach to improving profitability. This is the well-controlled trading needed to address the risks discussed in the previous chapter.
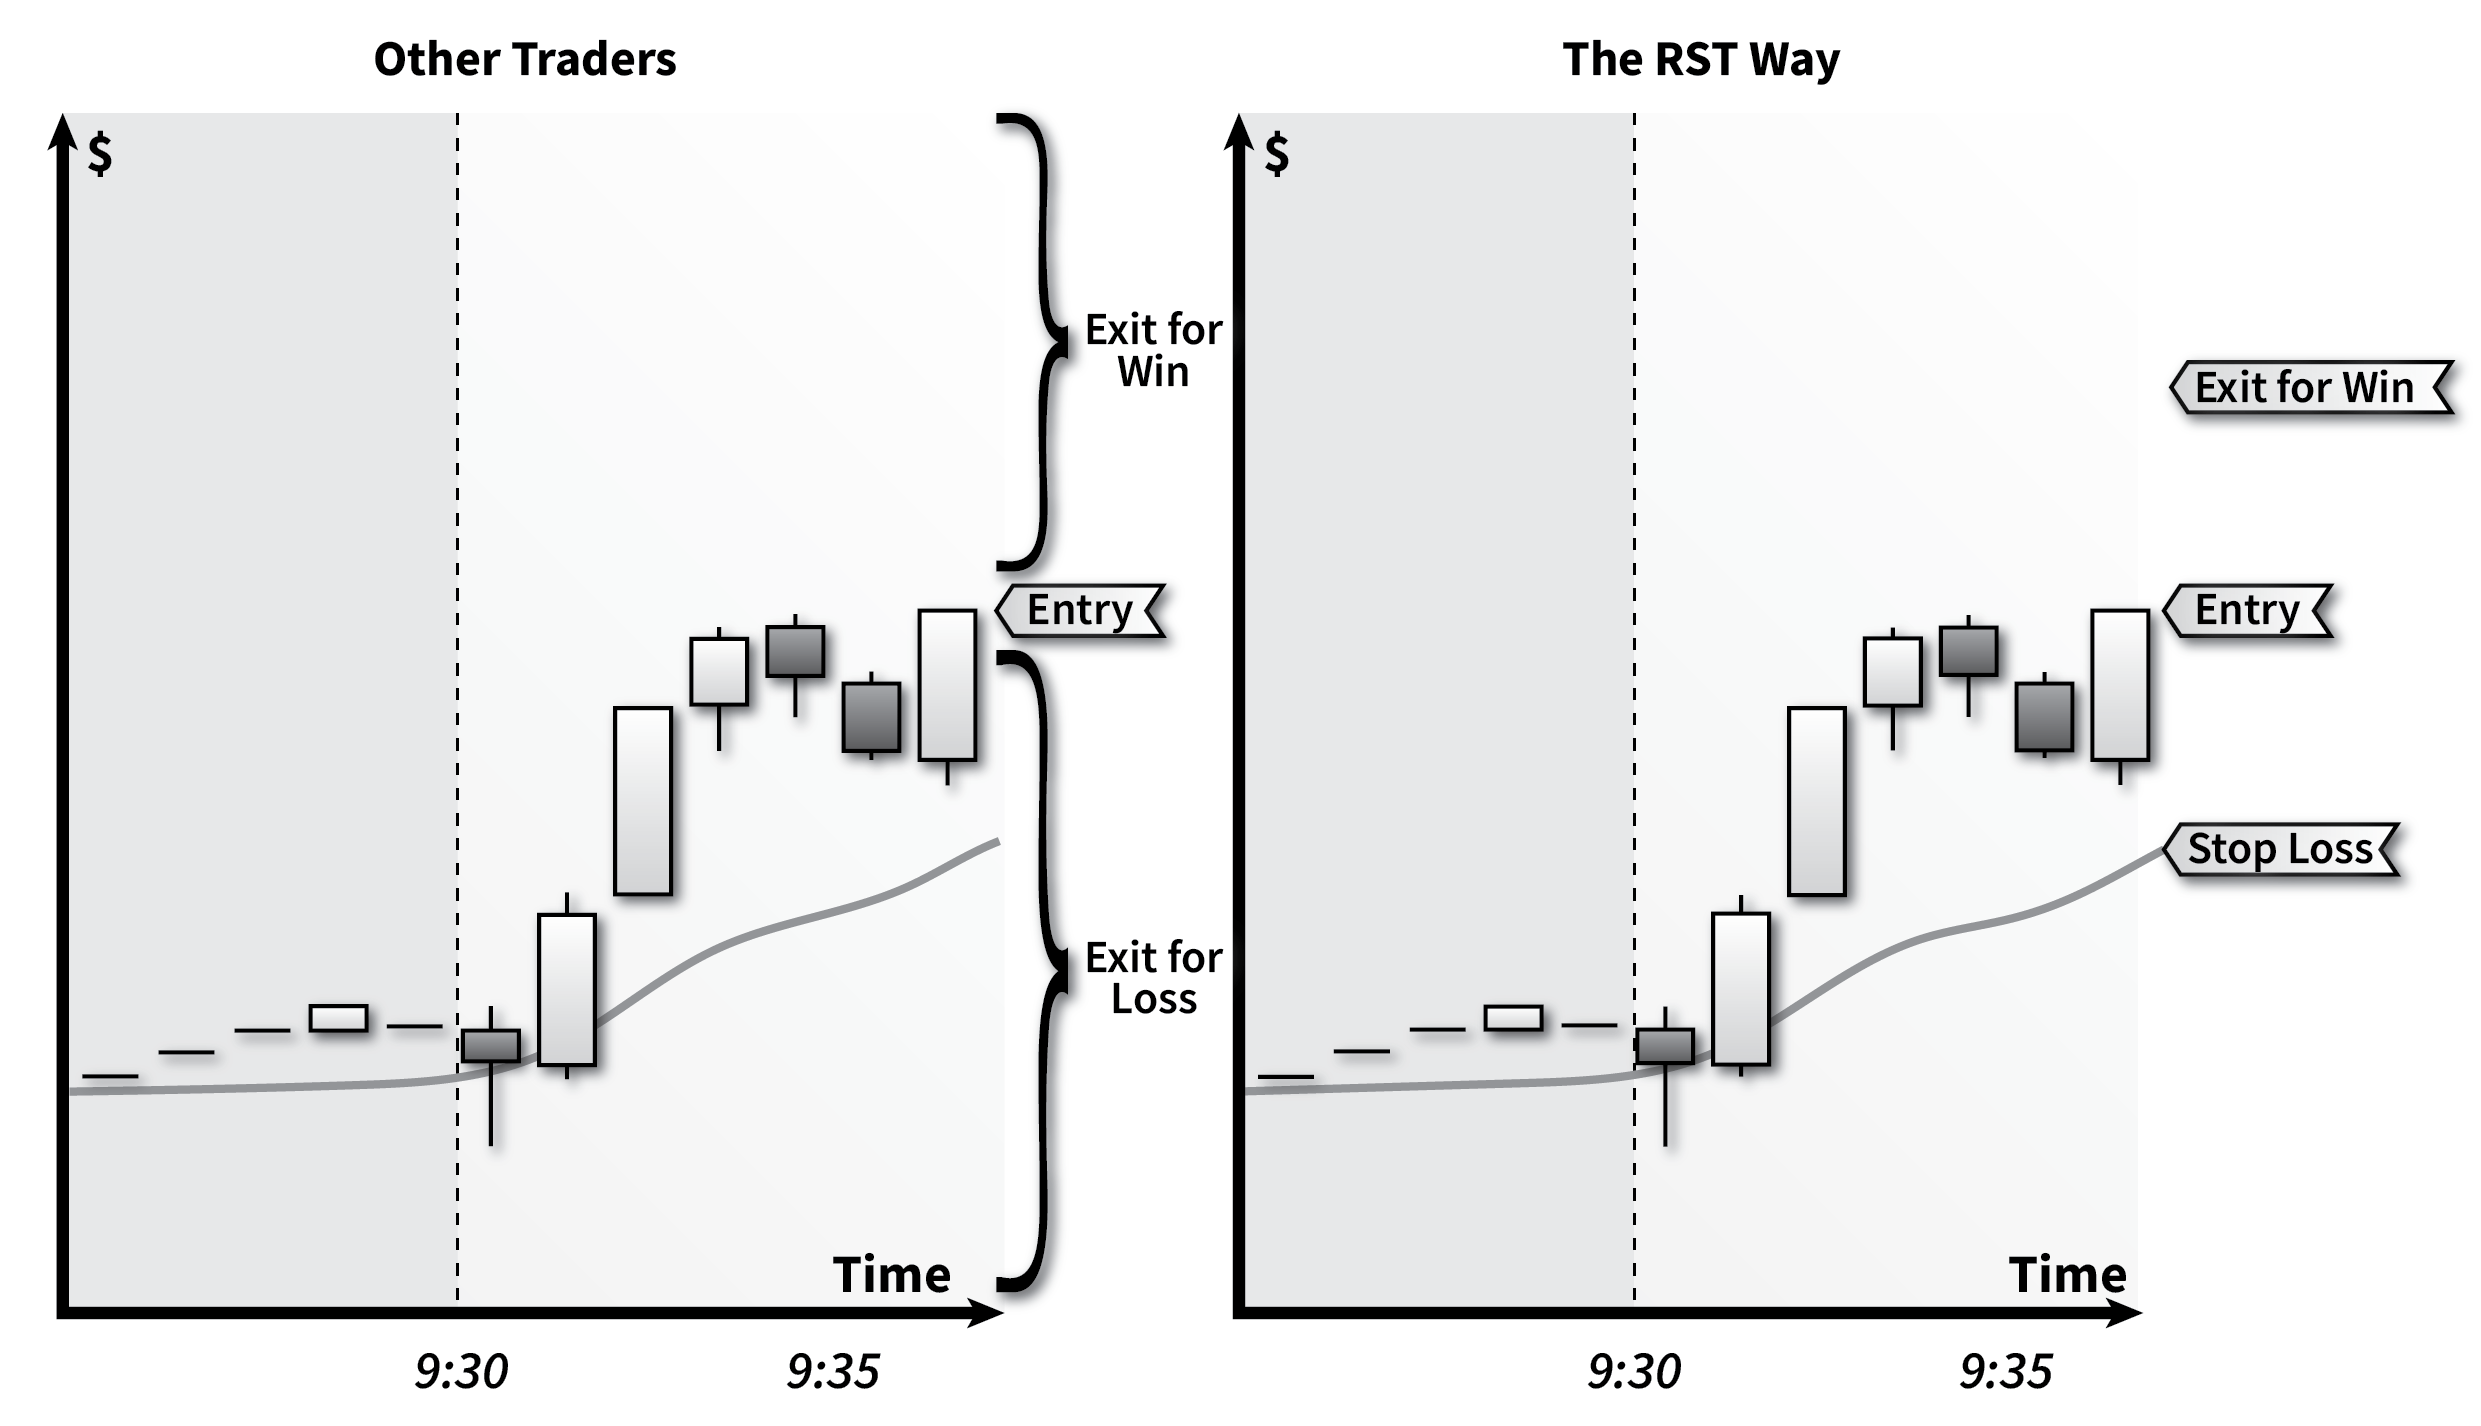
Figure 8.3. Candlestick charts comparing The RST Way to typical day trading.
When initiating a trade, an RST trader will set the stop loss in accordance with the candlestick pattern and exit at that price no matter what. Their share is then precisely calculated to yield the desired loss per losing trade. If the distance between entry and stop loss is large, then the number of shares is small, and so on.
Because RST traders use the exact same R/R ratio on each trade, the exit price for a win is also known at the moment the trade is initiated. The distance between entry and exit price for a win is simply a product of the trader’s R/R ratio and the distance between entry and the stop loss.
Then every trade will have “controlled win/loss amounts” such as “$300/$600” and “fixed R/R ratio” like “1/2”. This is binomial process trading.
The goal of binomial process trading is to eliminate the variability traders see trade to trade and transform it into a game with only two outcomes: win $X or lose $Y (“binomial” means “two terms”). By doing so, we transform trading into a binomial process where “a win is a win” and “a loss is a loss,” similar to flipping a coin or rolling a die.
The most important thing to understand about binomial process trading is that it will break even when trading completely at random. In other words, you can let your cat choose between long or short for you, for any stock, at any time, and breakeven (minus commissions and fees), which, according to the researchers, is better than 99% of day traders they studied. That is the beauty of BPT.
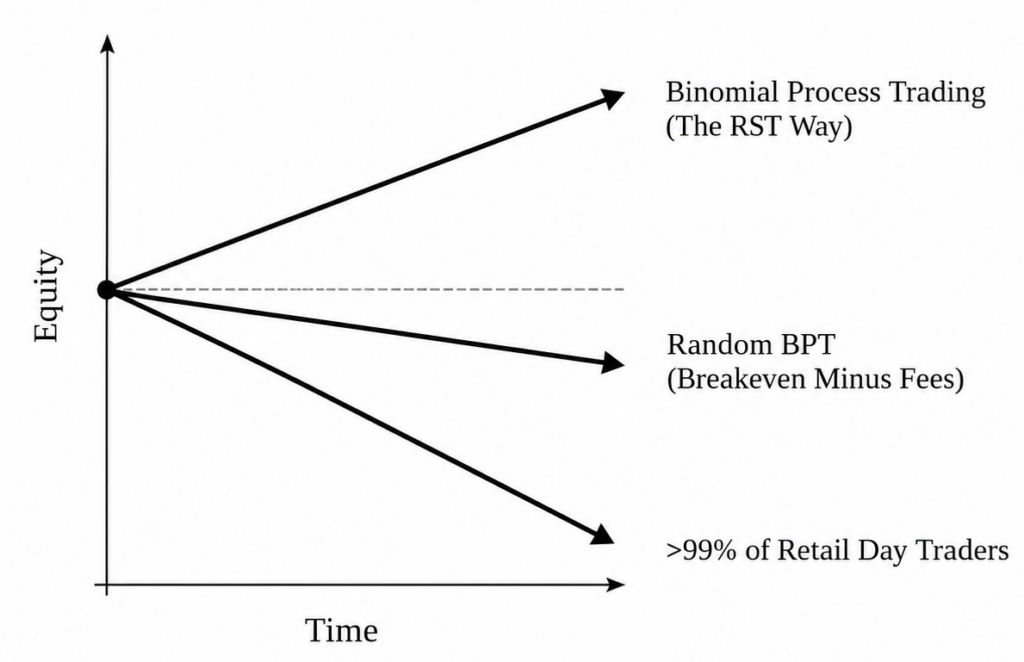
Figure 8.4. Account growth trend comparison.
Referring to Figure 8.4, the difference between the middle equity trend line (random RST/BPT trading) and the bottom equity trend (other traders) is enormous. That is the difference between surviving for years as a trader and going broke in a few weeks. That is the power of binomial process trading and why it’s like a cheat code- you instantly jump to the head of the line. You may not be profitable yet with pure random trading, but at least you won’t be hemorrhaging money. You have a fighting chance and only need to nudge the win rate a few more points to cover commissions and fees and be profitable (the top line – The RST Way).
Wouldn’t it be amazing if such a cheat code existed in sports or other aspects of our lives? Imagine doing just one thing that instantly propelled you to the top 1% of people doing that activity. I can’t think of another activity that has a feature like this.
The RST Way was started after thinking: “If I automate my share size such that I always have $100 losses and $100 wins, then all I need to do is read the candlesticks properly 55% of the time to cover commissions, fees, and the bid-ask spread—and be profitable. If a cat’s win rate would be 50% with this system trading at random, then surely I can use my big human brain to get just 5% more to cover these fees and be profitable.”
The beauty is that it directly addresses each of the risks described in the previous chapter. Perhaps the most exciting benefit is that it is a very simple and elegant form of trading that is also straightforward to diagnose and improve, as we will discuss in the next chapter. This is perhaps the greatest benefit of The RST Way compared to other trading methodologies.
Table 8.2 describes how The RST Way addresses each of the risks described in the previous chapter:
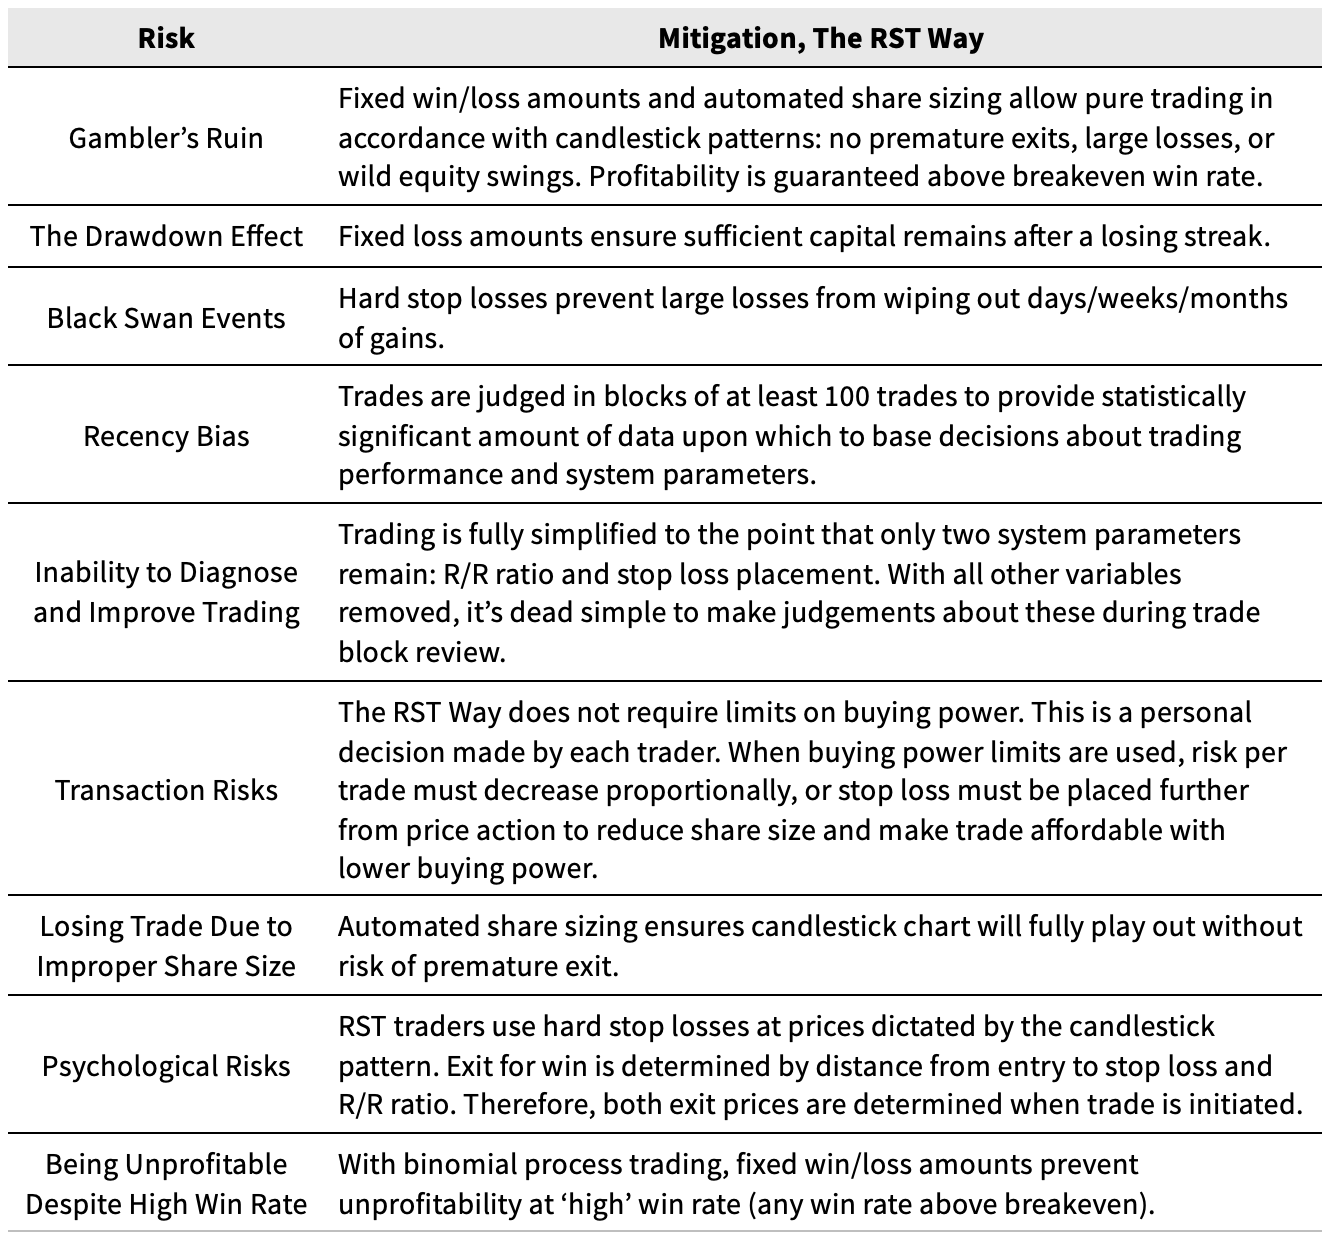
Table 8.2. How The RST Way addresses day trading risks.
In addition to BPT, there are a few other components that make up The RST Way:
- Risk size based on losing streaks and The Drawdown Effect
- Losing Streak Circuit Breaker
- Share size based on risk size / stop loss
- Automated share sizing
- Fixed risk/reward ratio
- Hard exits
Losing Streaks, Drawdown Effect, and Risk Size
Losing streaks are unavoidable for traders. Let’s assume the average trader’s win rate is 50%, similar to flipping a coin. If you flip a coin 1000 times, you expect to have roughly 500 heads and 500 tails. The same would be true for trading with a 50% win rate.
However, there is one important concept to remember:
The number of wins and losses in a sample of trades can theoretically be anything.
That understanding drives our entire risk management plan.
When flipping a coin, the most likely result is 500 heads and 500 tails, but anything from 0 to 1000 heads is theoretically possible. You could flip a coin 1000 times every day for a year, and get a different number of heads every day. Mathematicians call this difference between expected and observed outcomes “sampling error”.
Understanding sampling error is paramount to your success as a day trader, particularly as you experience streaks of wins and losses. The last thing you want to do is burn a million-dollar playbook because the first few days or weeks were unprofitable.
First, you need to understand how long “reasonably sized” losing streaks will be at your win rate. This dictates two key aspects of our risk management:
- Tells us how much we can risk per trade, so our capital is not wiped out by a losing streak (The Drawdown Effect).
- Prevents us from scrapping a million-dollar playbook too soon (Recency Bias).
There are two things we need to do:
- Calculate the size of losing streaks that have a reasonable likelihood of occurring.
- Determine risk size (percentage of capital lost on each losing trade) using the “reasonably worst-case” losing streak so that we have sufficient capital remaining after the losing streak in order to avoid issues caused by the Drawdown Effect.
To calculate the “reasonably worst-case” losing streak, we’ll utilize a trader’s favorite distribution, the binomial distribution. We’ll discuss the binomial distribution in detail in the next chapter, but we’ll also rely on it here for the “reasonably worst-case” losing streak calculation.
“Reasonably worst-case” is the same as saying “within a certain confidence level”. We know a losing streak of any size is theoretically possible, but what is the longest streak we can expect to see in a block of 100 trades, 90% of the time? (That “90%” is our confidence level.)
To calculate this, we can use the formula in Figure 8.5:

Figure 8.5. Probability S of getting K or more successes in a row out of N trials. p is probability of success, q is probability of failure, and T is a variable of summation.
For a trader with 50% win rate, the answer is 9 trades. In other words, more than 90% of 100-trade blocks will not see a losing streak of 9 trades or longer. The other 10% of blocks may have longer losing streaks.
Therefore, in my opinion, you should be prepared for up to 10 losing trades in a row if you are truly a 50% win rate trader.
To account for the drawdown effect, in my experience, you want to keep at least 80% of your capital after the losing streak. With this much capital, you can still trade with the same win/loss amounts you had at 100% capital, with almost no impact on your trading.
What I mean by that is you can continue using the same win/loss amounts and trade as if the losing streak never happened. If you were trading with $1000 wins and $500 losses at the original account size, you can still use those win/loss amounts at 80% capital just fine.
The difference is that you will have 20% less buying power and have an increased likelihood of not being able to enter certain trades if you cannot afford the correct number of shares that fits your risk amount. More on this later in the chapter.
Personally, I believe the effect is not a big deal at 80% and have no problem trading as normal. However, if your capital went all the way down to 50% after a losing streak, then you would struggle to enter trades with the same risk size and be forced to either take fewer trades or reduce win/loss amounts. In that case, you are falling victim to the Drawdown Effect risk and will struggle to return to breakeven.
If 80% of starting capital is where we want to be after a losing streak, and we want to account for a losing streak of 10 trades, then our risk per trade should be 1-2% of starting capital.
If the risk per trade is 2%, then after 10 consecutive losing trades, the capital will be exactly 80% of the starting capital. Remember, the risk per trade is based on starting capital, not current capital. That would violate BPT rules, as the win/loss amounts would shrink after every losing trade.
If the risk per trade is 1%, then the remaining capital would be 90% after a 10-trade losing streak.
In my opinion, both scenarios are perfectly fine, so it is up to the trader to balance risk size, the ability to grow the account quickly, and the risk of precluding the trade from happening. We’ll discuss this balancing act, which involves a few other variables impacting trader income, in the next chapter.
Losing Streak Circuit Breaker
Whenever we experience one of these unusually long losing streaks, we need to interrupt our trading and examine the cause. Is it just bad luck, or are we failing to execute the trades properly?
If it’s just bad luck, so be it; if it’s due to poor execution, we need to fix the problem immediately. Are the hotkeys doing what you expect them to be doing? Do the chart setups match your playbook? Are the stop losses too close or too far away (don’t match your playbook)? These types of execution errors are the only things that should be tinkered with during a trade block.
Share Size
There are two common methods traders use for share sizing: fixed share size or fixed buying power. Fixed share size means trading X number of shares per trade. They will add/remove as they see fit throughout the trade (as shown in Figure 8.2 with the multiple entries/exits marked on the chart).
The alternative is fixed buying power, which involves trading the maximum number of shares they can afford with X% of buying power, such as 25% or 50%. Some traders use this method so they can be in multiple trades at once, which is not always possible with the fixed share-size method, as up to 100% of a trader’s buying power may be required for larger share sizes and more expensive stocks.
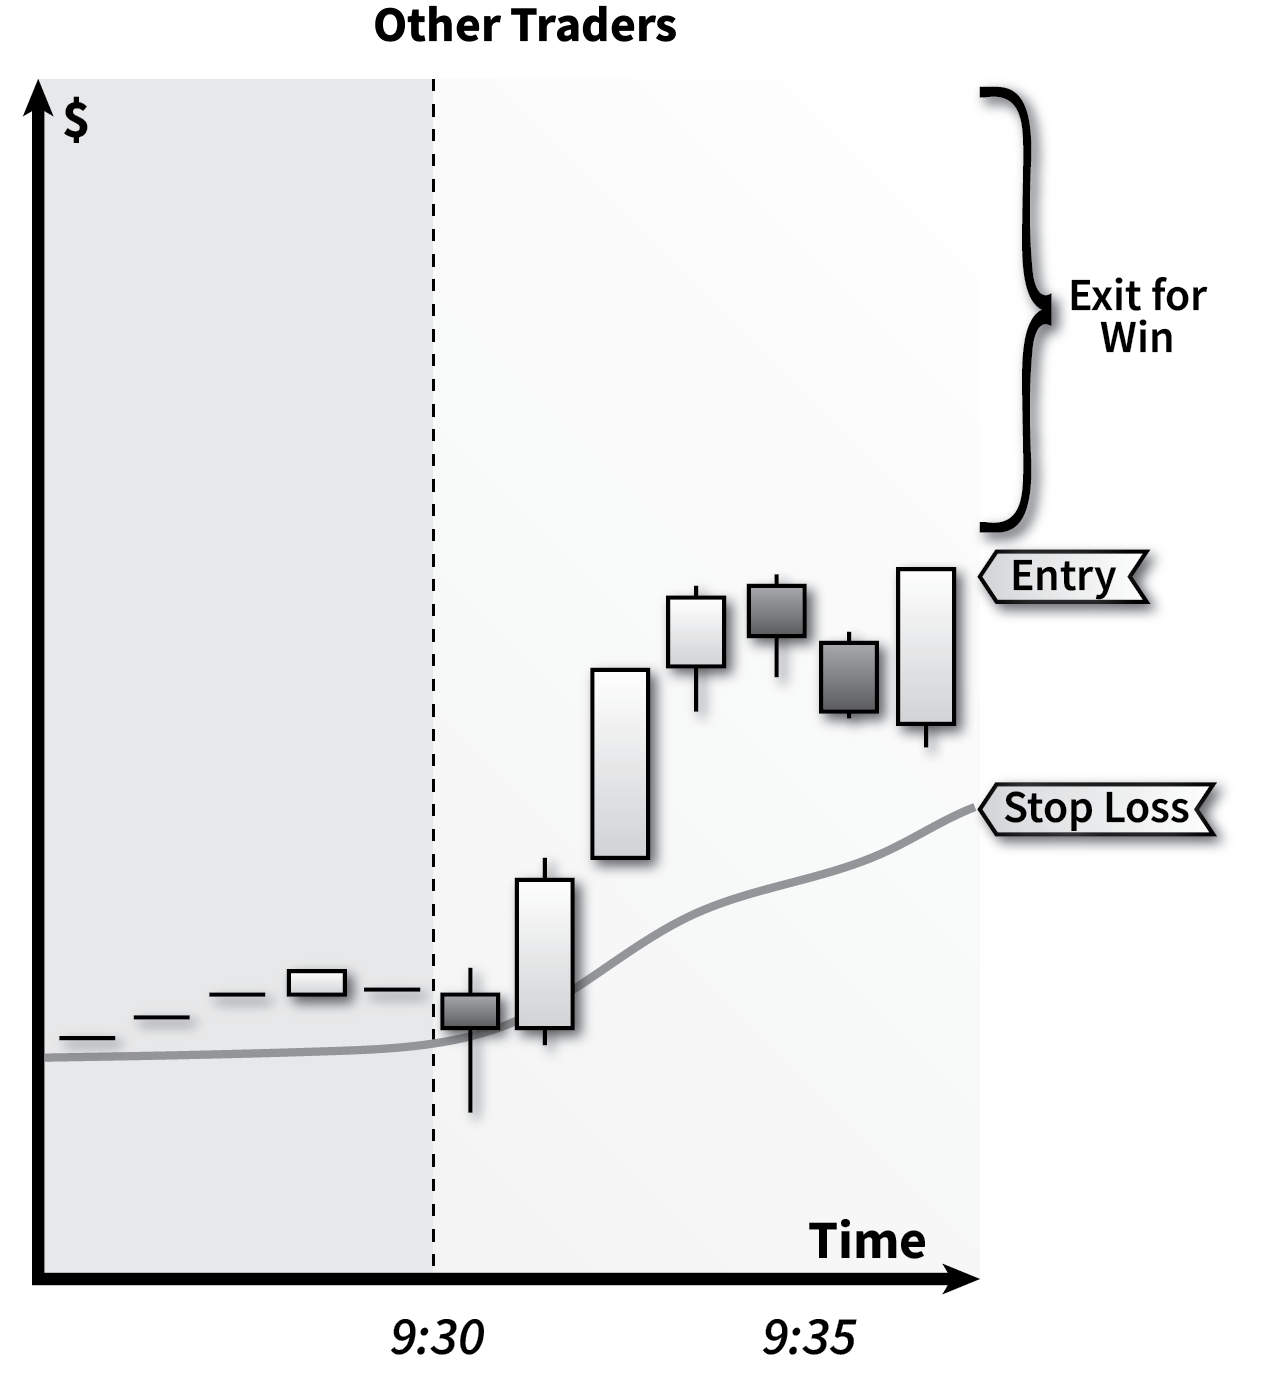
Figure 8.6. ABCD pattern at market open.
We’ll use the ABCD setup in Figure 8.6 to illustrate some of the issues associated with these two methods of share sizing. For now, let’s pretend the candlestick pattern actually goes all the way to the stop loss and the trader gets stopped out for a losing trade.
If the price change from entry to stop loss is $0.40 and the trader uses a fixed share size on every trade, such as 100 shares, the trade would result in a $40 loss. Not too bad.
But if this same pattern appears on an expensive stock like TSLA or MSFT on a volatile day, the drop it represents could be $10 or more, meaning a loss of $1,000 instead of $40. Ouch.
$40 and $1,000 are worlds apart, and you can see how it’s only a matter of time before the trader gets into the wrong stock at the wrong time and takes a big loss. Or maybe it’s not one bad loss, but a pattern of “mini catastrophes” that consume the trader. Either way, it’s only a matter of time before they are consumed by this process, which is the “Gambler’s Ruin” we discussed in the previous chapter. If you’ve experimented with day trading before, then you know exactly what this is like.
To counter this, these traders will use different share sizes for different levels of volatility. This is a well-meaning step, but ultimately it is a band-aid on cancer. They may use two or three share sizes, such as 25, 50, and 100 shares. But volatility is a continuum, so what they really need is a share size that precisely fits the risk (similar to The RST Way). The result is that their share size remains either too small or too large, leading to uncontrolled trading and eventual Gambler’s Ruin.
The situation is even worse when basing share size on buying power. This means share size is based on stock price (buying power divided by stock price), so it could range from 1 to 10,000+ shares. Traders may do this to address transaction risk or simply allow for more simultaneous trades. However, when you combine the wild variation in share size with the wild variation in volatility, you’re in for one hell of a ride!
Another way traders mitigate the impact of uncontrolled trading is to limit losses by imposing a “max loss per trade” rule. This is usually about 1-3% of the account size, so let’s say $300 for a $30,000 account (1%).
If you use a max loss per trade rule while also basing share size on buying power or using a fixed share size, there’s another trap that you can fall into. Referring back to the candlestick chart above, the stop-loss price is set to give the trade enough room to breathe and maximize profitability. The problem is, when you trade more volatile stocks as day traders like to do, you might realize a $300 loss instantly with a relatively small change in stock price. The theory you had in mind when entering the trade never had a chance to play out.
Getting stopped out like this is very frustrating for traders. The whole point of technical analysis is to let the candlestick pattern play out as drawn up. Trader performance should be driven by the ability to read markets and charts, and not sabotaged by improper share sizing and poor risk management. Trading The RST Way creates that environment for traders.
Now we’ll switch gears and look at how the same candlestick chart would be approached by RST traders. While other traders have uncontrolled and unpredictable exits, RST traders always have well-defined exits (hard stops) for both winning and losing trades as shown in Figure 8.7:
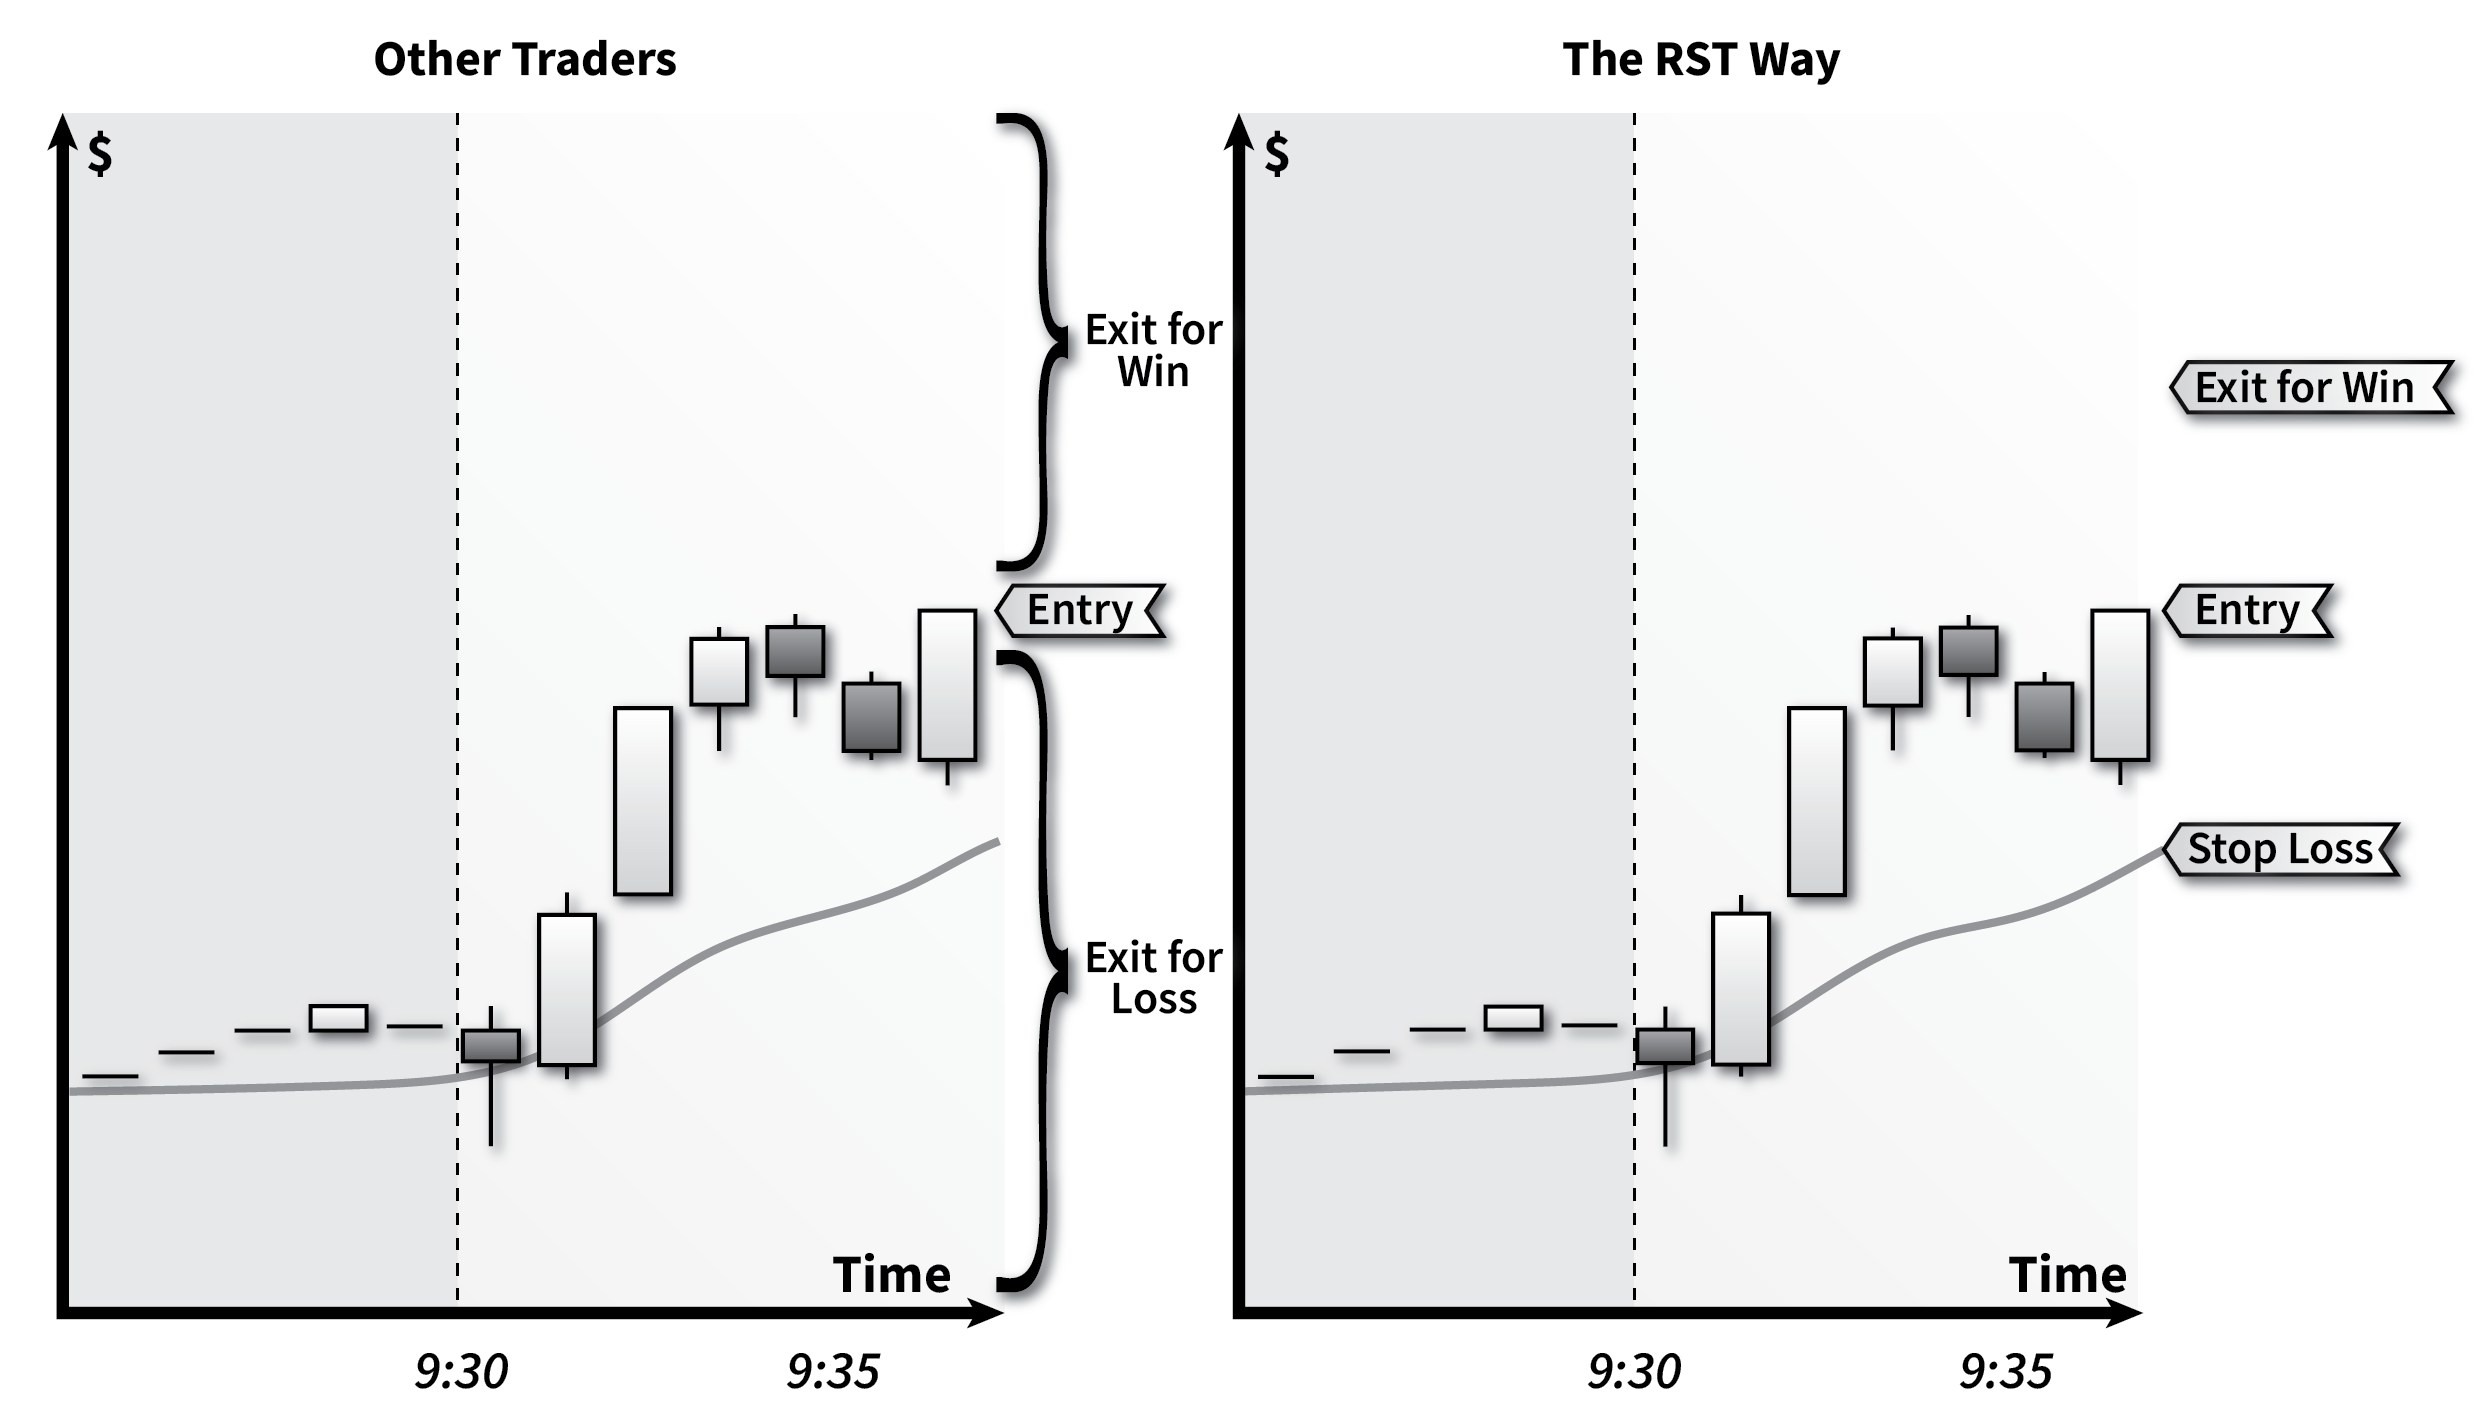
Figure 8.7. Other traders versus The RST Way.
In this example, the trader is using an R/R ratio of 1/1, so the stop loss and exit for win are equal distances from the entry. The share size is based on the desired loss/risk size and distance from entry to stop loss (Figure 8.8).
If the trader wants a $300 loss on every losing trade (1% of a $30,000 account, for example) and the distance between entry and stop loss is $2, then the share size will be 150 shares to yield a $300 loss at the stop loss price.
With this method of share sizing, the loss size will always be $300, regardless of the stock’s volatility. The share size is always exactly what it needs to be to let the candlestick pattern play out as intended and result in the correct win/loss amounts.
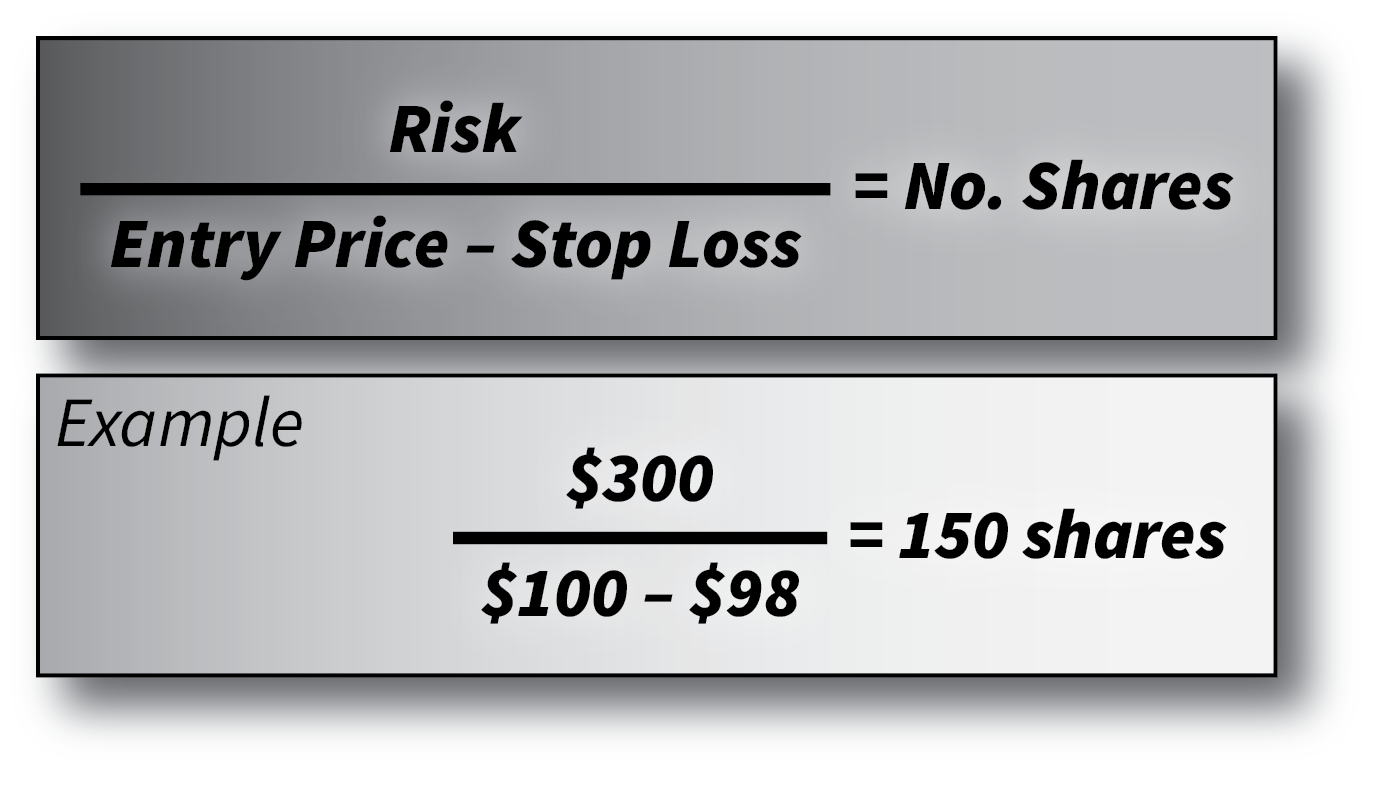
Figure 8.8. Share size based on risk calculation.
Transaction Risk – Buying Power Limitations
One issue RST traders may run into (which is also an issue when trading fixed number of shares, but notan issue when basing share size on buying power) is that sometimes the number of shares required to fit the risk may exceed a trader’s buying power. This happens when the trader uses a risk that is too large relative to the account size (>2%) or when the distance between the entry and the stop loss is relatively small. Both of those situations require a larger number of shares (see Figure 8.8), which could exceed the trader’s buying power.
RST traders have two options to avoid having share size exceed their buying power and being unable to enter the trade.
First, the trader can decrease the risk size- instead of using a 2% risk per trade, use 1.5% or 1.0%. Fractions of a percent can make a big difference. Feel free to start at 2%, and if you run into issues, keep decreasing by 0.25% until you no longer run into buying power limitations.
In addition to lowering risk, you could move the stop loss farther from the price action, reducing share size and required buying power for the trade. However, bending the rules of the candlestick chart pattern could adversely impact win rate and profitability, which is another aspect of the balancing act we’ll discuss in the next chapter.
Lastly, there is another transaction risk related to buying power. Some traders may not be comfortable committing up to 100% of their account and buying power on a single trade. The hard stop loss is meant to limit the loss to 1%, but that assumes you are able to exit the trade. What if there is a glitch in the trading platform or ECN, and instead of a 1% loss, it becomes a 100% loss? (Personally, I do not worry about this as I have never traded with funds that my life depended on, but I would certainly understand if this is something you considered a legitimate risk.)
In addition to the glitch risk, there is an opportunity risk as well. If 100% of your capital is involved in a trade, you will not be able to take more than one trade at a time, which day traders often like to do since they are trying to capture as many opportunities as possible in the first 30-60 minutes after market open.
Again, the way to lower buying power per trade is to reduce the risk amount or move stop losses farther from the price action.
In general, I rarely run into issues where a single trade maxes out my buying power. Maybe two or three times per week at most. In addition to lowering the risk size or moving the stop loss further away from the entry, the trader can consider trading on larger time intervals, such as 5-min or 10-min candles instead of 1-min candles. This effectively moves your stop loss farther from the entry price and reduces the required buying power.
In summary, the three ways to avoid maxing out buying power are:
- Decrease risk size
- Move stop loss further away from entry (be careful not to violate playbook)
- Trade longer time frames
Automated and Manual Share Sizing
Most day traders like to enter a position at the moment a pull-back or change in momentum occurs, so they get the best possible price and the highest likelihood of winning the trade. These opportunities may only last a few seconds.
Given the short amount of time to nail the entry, getting out a calculator or spreadsheet to calculate share size is not very practical.
If you are trading on longer time intervals, where the trade lasts hours, days, or longer, then it’s no issue. But for frantic day traders at the market open, the share size must be automated in order to implement binomial process trading.
This is very easy to do in a trading platform like DAS Trader, which can automate the entire process. I have evaluated several other trading platforms, including those with scripting and automation features, but have not found one that can automate the process as effectively as DAS Trader.
DAS Trader has “hotkeys”, which are essentially buttons you click in the software or on your keyboard, that then execute a custom script created by the trader.
DAS Trader also has “range order” functionality, which is perfect for The RST Way, which relies on precise, predetermined exit prices.
With DAS Trader hotkeys, you can set your desired win/loss sizes and have the script automatically calculate the share size. The entire process of trading The RST Way in DAS Trader is as follows:
- Trader double-clicks on candlestick chart in DAS Trader at the desired price for the stop loss and activates the long or short hotkey by clicking it in the montage window or pressing the linked key on their keyboard or macropad (the trader is now completely done with the trade and DAS Trader does everything else).
- DAS trader uses the formula in Figure 8.8 to calculate share size.
- The position is opened with a range order at the predetermined exit prices. The exit price for a loss is exactly where the trader double-clicked on the chart to set the stop loss, and the exit price for a win is exactly in accordance with the trader’s R/R ratio (Figure 8.7).
- DAS Trader exits the position when either exit price is reached.
Notice that step 1 is performed by the trader, while DAS Trader handles everything else. The trader’s job is technically done before the trade is even filled. When trading The RST Way, gone are the days of agonizing every second of every trade over when to exit.
That said, never leave your trades unattended. I recommend having a ‘panic’ hotkey ready to immediately close out your open positions in case the trading platform glitches or does something unexpected.
If you’re trading on a different platform and are unable to automate the process, you’ll have to manually calculate the number of shares using the equation in Figure 8.8. At that point, you’ll know the stop loss price and number of shares- the remaining piece is the exit price for a win. You can calculate it by taking the distance from the entry to the stop loss and multiplying it by the R/R ratio. If it’s 1/2, then the exit for a win will be twice as far from the entry as the stop loss, and so on. Finally, you’ll need to watch the trade like a hawk and exit as soon as either exit price is reached. This can be extremely difficult to do in volatile markets- if you’re trading manually like this, I recommend trading a longer timeframe with 5m candles or longer so you’re not as vulnerable to each penny in price action.
Risk/Reward Ratio
The true reason we want perfectly controlled binomial process trading is so that we can trade in accordance with Figure 8.9:
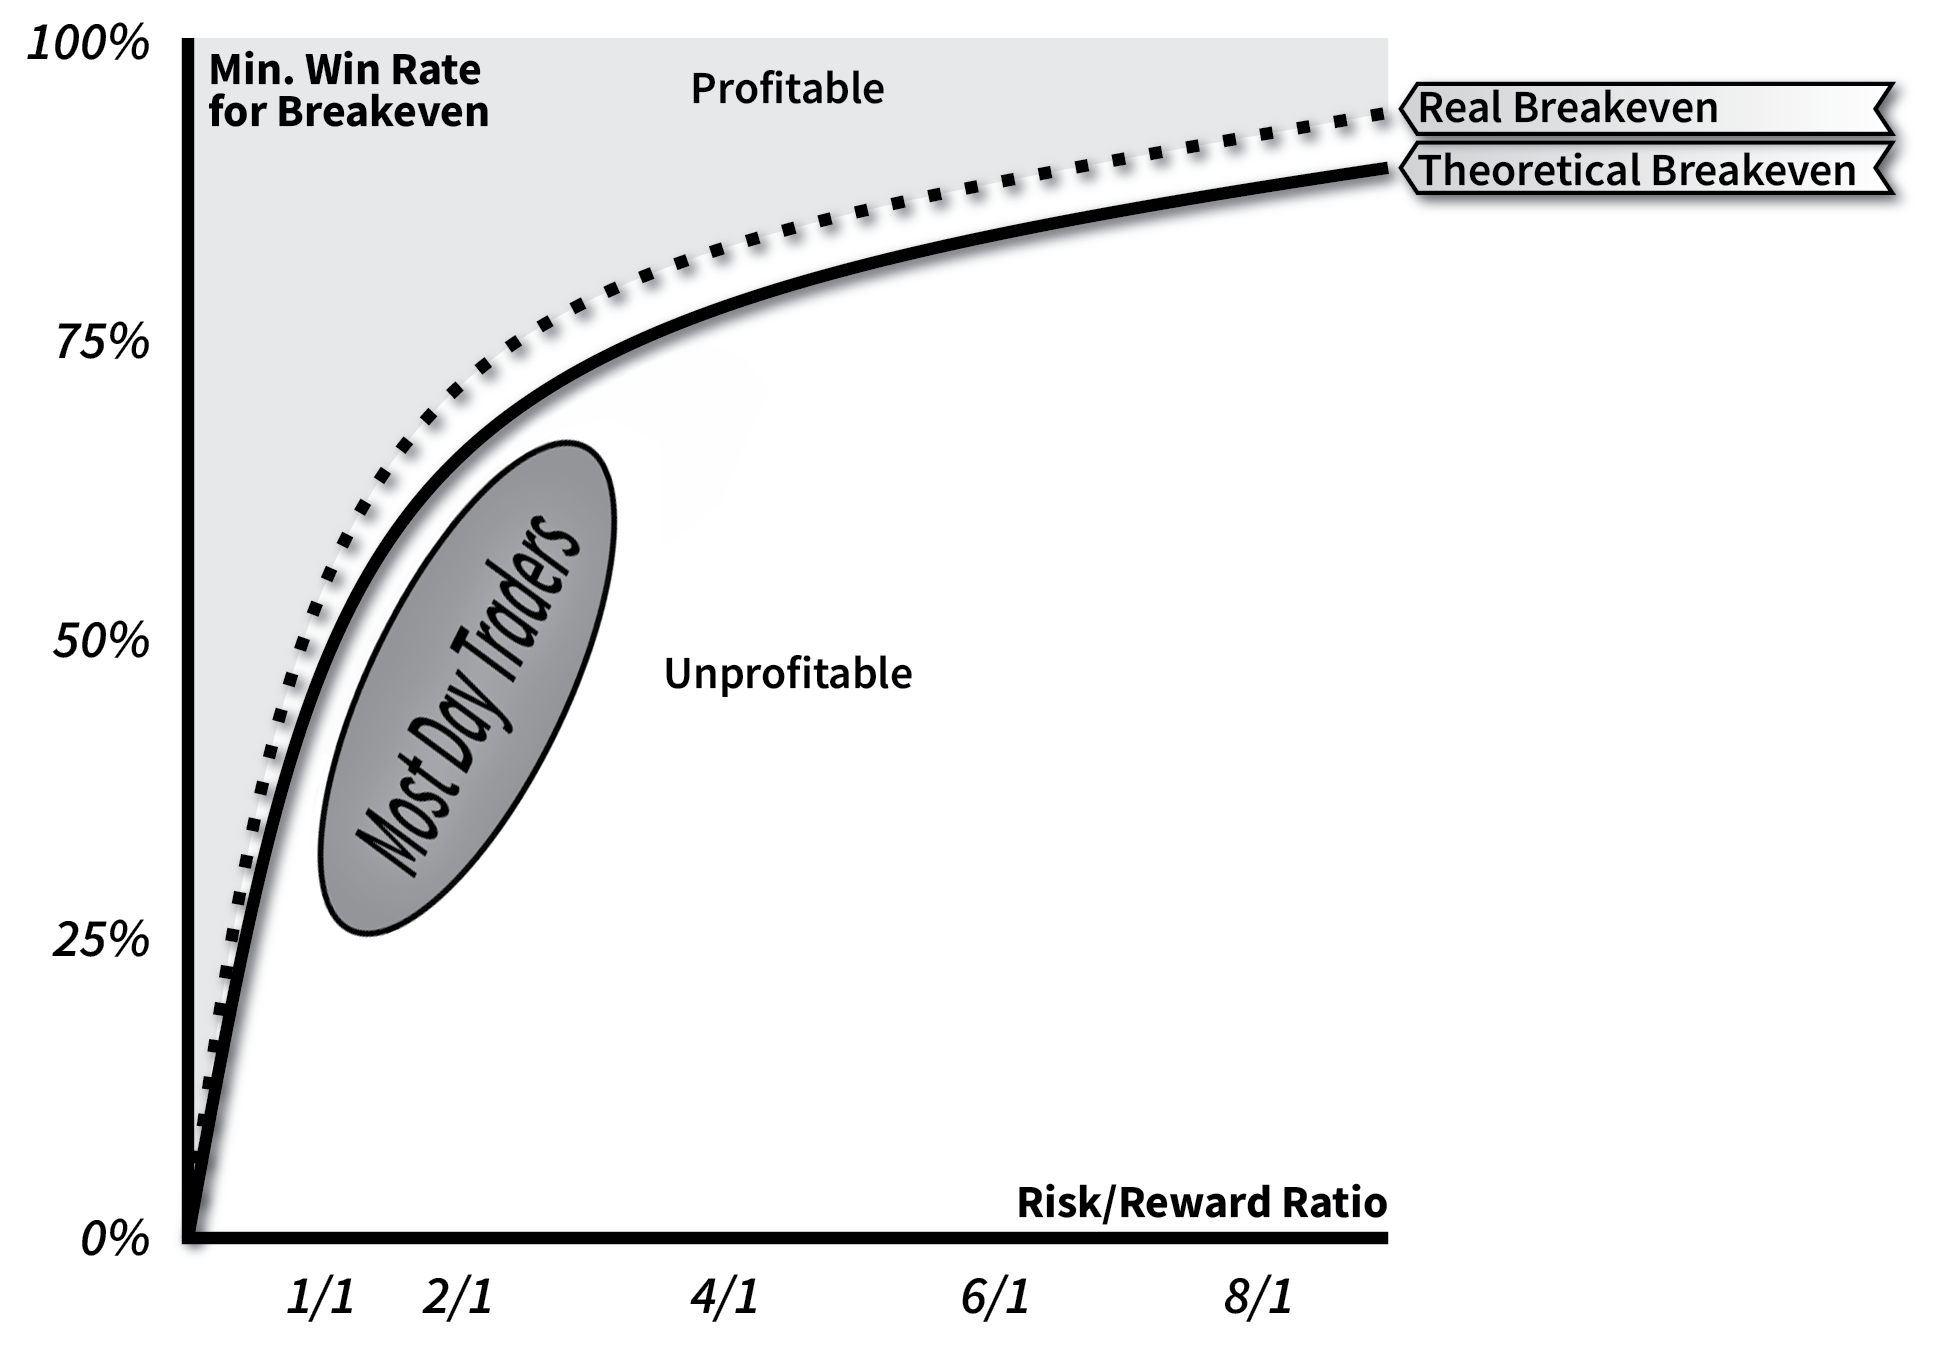
Figure 8.9. Minimum Win Rate for Breakeven Versus R/R Ratio.
I hinted at the reason for this chart’s importance earlier in the chapter when I said BPT breaks even when trading at random, even if it’s your cat picking long or short on any stock at any time, using a completely random stop loss placement. BPT’s control over win/loss amounts guarantees that it happens (minus commissions, fees, and bid-ask spread).
The curve in Figure 8.9 shows the minimum win rate needed for a given R/R ratio. At an R/R ratio of 1/1, the minimum win rate is 50%. For 1/2 (wins twice as big as losses), then you need to win at least 33% of your trades, and so on. That is, if traders weren’t subjected to broker commissions, transaction fees, and having to cover the bid-ask spread. Fortunately, these are not that expensive, and it only takes about a 3-5% increase in win rate to cover them for most traders.
It’s important to recognize that any R/R ratio can be profitable. It rubs traders the wrong way to think about having loss size greater than win size, but there may be playbooks that benefit from that. These are trades where you give a lot of room on the stop loss with a very close exit for profit. This would of course lead to more wins, but the losses would be larger, so there is a trade-off.
In the next chapter, we’ll discuss further how to find the R/R ratio that works best for you. The greatest benefit to The RST Way is that by trading in accordance with this graph using BPT, we are always profitable at the minimum win rate. The controlled win/loss amounts guarantee that. While other traders can hemorrhage money despite a high win rate, this is not possible under The RST Way. Furthermore, while 99% of traders have negative equity curves, RST traders start out at breakeven, giving them a much stronger chance of profitability than the alternative.
Mental Versus Hard Exits
The RST Way relies on hard exits that are always enforced. However, most other day traders typically use mental stops for their stop losses. Generally speaking, they simply exit when the unrealized loss becomes uncomfortably large.
The main problem with mental stop losses is that they are rarely executed accurately, especially on volatile stocks. Furthermore, if the exit depends on the maximum loss size, the position may have to be exited at a loss long before the candlestick chart has a chance to play out. In the end, mental exits lead to poor R/R ratio and win rate, and therefore unprofitable trading.
In order to ensure a fixed R/R ratio and controlled win/loss amounts as required for binomial process trading, RST traders must use hard stops for each of their trades. Mental stop losses and exits are not part of The RST Way.
What is Missing (by Design)
Things that are not part of The RST Way are just as important as the things that are.
First, there are no partials when it comes to entering or exiting the position. That wrecks the R/R ratio and leads to extremely uncontrolled trading.
Second, there are no “breakeven” trades. Every trade is closed for either a full win or full loss. This creates the binomial game we aim to take advantage of as RST traders. Once in a while, immediately after entering a trade, it may become obvious that the trade was a bad idea once the standby exit orders are drawn on the chart (assuming you use DAS Trader). If you feel the trade was a mistake, and the exits do not really fit the candlestick pattern and price action, then you can exit for close to breakeven and chalk it up to the cost of doing business. These occasions should be rare enough (less than 5% of trades) to not significantly impact your bottom line. I would exclude these trades from the trade review process discussed in the next chapter.
Third, chart indicators are not banned from The RST Way, but part of the RST philosophy is to make trading as simple as possible, so I generally recommend avoiding them unless you have a very strong reason for using one. If you add a rule to your playbook based on an indicator, that’s just one more thing you have to think about later during trade block review.
Finally, daily goals/limits are another aspect of the typical trader’s experience that is not part of The RST Way. Daily goals are total nonsense in my opinion. Actually, this is not just my opinion, it is fact rooted in statistics and probability theory. As we’ll discuss in the next chapter, trading should only be judged on a samples size of 100 trades or more. What happens on any given day is immaterial. Take as many-or as few- trades as you see match your trade playbook on any given day.
BPT for Other Types of Trading or Gambling
Transforming other activities (such as gambling, sports betting, and options trading) into BPT requires varying the share size or the bet in a way that yields consistent win/loss amounts and a fixed return-to-risk (R/R) ratio. For example, sports betting can be transformed into BPT by wagering an amount that always results in losses of $500 and wins of $1000. That is an R/R ratio of 1/2, so the bettor would only take bets they felt would result in a win rate of at least 35-40% to be profitable within that system. However, this would require taking only bets with odds of 2:1, or treating each odds value as its own RST/BPT system.
Many sports bettors may be familiar with the Kelly Criterion, which determines how much capital should be put into a bet based on net odds and expected win probability. This is useful if you have a history of trades from which to estimate the win probability. The Kelly Criterion is not useful for RST traders or anyone using BPT. While the Kelly Criterion is a method for maximizing returns across multiple bets/investments with varying expected returns by defining the risk amount, BPT enforces a binomial process in which all bets/investments have identical risk amounts and returns.
With BPT, the bet/trade must always be allowed to reach the predetermined exit prices, which can pose problems in cases where the time horizon is weeks or months. That is a long time to keep capital tied up. This would not be an issue for sports betting, but would be a problem for something like a portfolio of real estate investments, where it may be difficult or impossible to estimate when the expected return or loss will occur. This will result in many exits before the predetermined win/loss sizes are reached and preclude a binomial process from developing.
Summary & The RST Risk Management Plan
The RST Way transforms day trading from a nerve-wracking, anything-goes nightmare into a perfectly controlled binomial process trading. With these controls in place, the system will break even on its own with totally random trading, which means the trader only has to nudge the win rate up a few additional percentage points using basic market awareness to turn a profit.
The following three tables include all the components of The RST Way. This can also be called the RST risk management plan, or RST trading system. The first table is immutable and the same for all RST traders, and contains the core elements of The RST Way. The second table lists the user-defined aspects, which include the parts the trader will modify to optimize profitability in line with their unique trading style. Last but not least, the third table is the one that requires skill and experience to master; it is not just a choice to make or a setting on the trading platform.
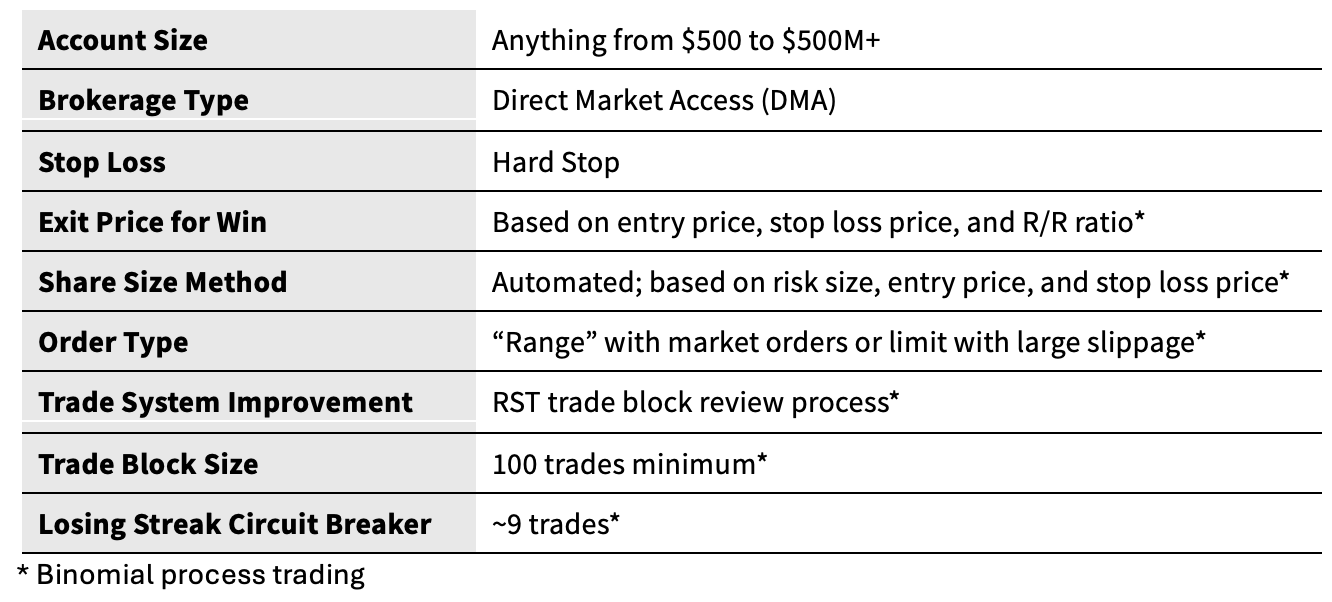
Table 8.3. Core components of The RST Way.
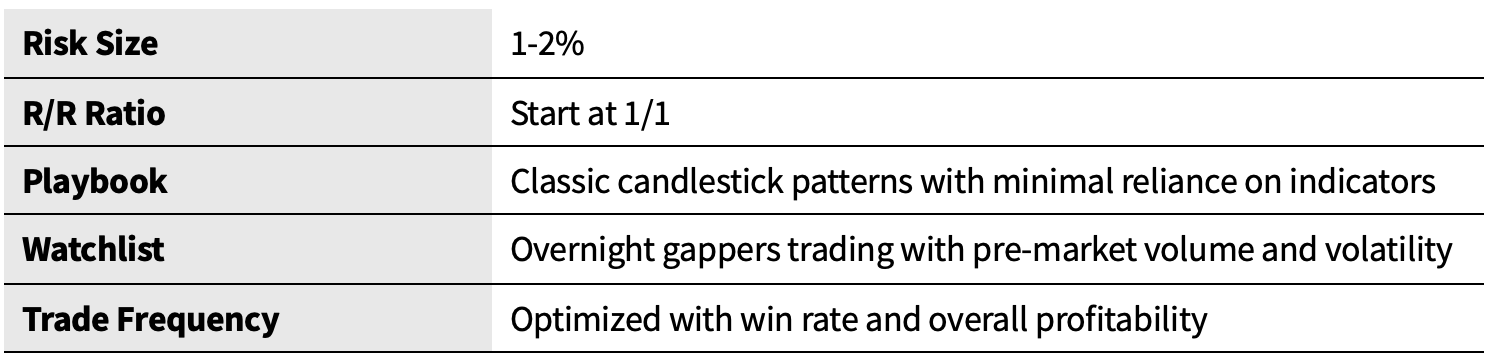
Table 8.4. Trader-defined components of The RST Way.

Table 8.5. Trader skill-based components of The RST Way.
For the technical paper covering the expected-value model, assumptions, and failure modes, see Binomial Process Trading: Technical White Paper.
Continue with the full RST framework. This chapter is part of How to Day Trade Like a Rocket Scientist with Binomial Process Trading.