
The world of trading includes two broad categories of traders: “institutional traders” and “retail traders”.
The day-trading problem described in this chapter is the reason The RST Way uses binomial process trading: a controlled structure for turning trades into measurable win/loss outcomes.
Institutional traders include hedge funds, banks, high-frequency trading firms, and other agencies full of suits, ties, and Rolex watches. They have billions of dollars to trade with, and when they make moves, the market moves with them. They are killer whales and great white sharks, attacking the markets fearlessly and violently, using enormous buying power and share volume.
Retail traders, including us day traders, are the minnows surviving off the scraps left behind. The moves made by institutional traders create short-term market inefficiencies that day traders aim to exploit.
While the enormous hedge funds and banks throw their weight around, their trading directly impacts stock prices and trends. Retail day traders aim to observe these moves in real time and ride the waves created by the whales and sharks.
Types of Trading & Investing
There are a variety of trading and investing strategies that both institutional and retail traders use.
When stock shares are purchased and sold on the same calendar day, it is considered a “day trade.” If a position is held overnight, for days or weeks, it is referred to as a “swing trade.” Neither of these forms of trading is considered “investing.”
Investors contribute capital that businesses can use to grow. Traders, on the other hand, are nothing more than “parasites exploiting short-term market inefficiencies for personal profit, contributing little to no value to the markets, economy, or society,” as someone told me while I was trading in the corner of a Starbucks.
Traders hold positions from a few seconds to a few days, whereas investors hold positions for several weeks to years. If they are good, investors will want to know as much information about the company as possible. This is “qualitative” or “fundamental” analysis. On the other hand, traders are mostly “quantitative” or “technical” analysts and often do not even know the name of the company behind the ticker symbol they trade.
Day trading is considered active trading, whereas long-term investing is passive. Day traders actively watch the stock price throughout the time that the position is open. Investors often enter a position knowing it will be weeks or months before they do anything with their trade.
In a nutshell, day traders hope that their active, hyper-aware approach to trading volatile stocks for short-term gains will lead to considerably higher returns. In contrast, long-term investors hope that fewer, safer, less volatile trades will produce a respectable, albeit much lower, ROI with much less effort. Roughly speaking, the effort-to-ROI relationship holds.
Why Day Trade
There are many ways to earn a living, including speculation (trader, gambler, venture capitalist), prospecting (natural resource miner, fisherman), service provider (teacher, doctor, lawyer, waiter), intellectual property ownership (author, inventor, software developer), lender (bank, landlord), and manufacturer (factory, farmer). All these require you to rely on some combination of bosses, coworkers, and customers to operate. Day trading is one of the very few (perhaps only?) professions that does not rely on any of those. All you need is a brokerage account, a computer, and an internet connection. No drama, no office politics, no annoying customers, and no demanding bosses. It’s just you versus the markets.
Another incredible benefit of day trading is that it can be carried out from anywhere in the world. You don’t have to be in the U.S. or be a U.S. citizen to trade U.S. markets. You also don’t need fiber-optic internet and nine-plus monitors to trade. Many traders do just fine trading from beaches in the Caribbean with just a laptop on hotel Wi-Fi. The freedom to be anywhere in the world and still earn a living is perhaps the greatest benefit of being a professional day trader.
Day trading is also pandemic-proof. The markets did not close for a single minute during the COVID-19 pandemic in 2020. They did, however, see unprecedented volatility, which for day traders was like Christmas every day. Day traders don’t care if the markets are setting record highs or record lows – all they care about is that stock prices are moving. The worst thing for day traders is a calm, flat market.
Day trading can pay well in terms of money, but it pays the most in terms of time. Your workday can be over in less than an hour from the time you wake up; most people aren’t even at their desks within an hour after waking up. You have essentially gained your entire life back, allowing you to fill your days any way you want. Depending on your time zone, you may be able to keep your job while day trading, since it only requires 1-2 hours per day.
For these reasons, I believe day trading is the ultimate profession (or second profession). The combination of income potential, freedom, challenge, and fun is second to none.
What to Trade
One of the most popular instruments traded by day traders is US stock shares, especially high-volume, volatile stocks that can make big moves quickly.
ETFs (Exchange-Traded Funds) are also popular because they let traders play entire sectors, like tech or energy, without picking individual stocks.
Futures and options are also available to day traders, which are contracts tied to commodities, indexes, or currencies. These are attractive because of the high leverage they offer.
Finally, there is forex (foreign currency exchange) and cryptocurrency. These are 24-hour markets, unlike the US stock market, which has only 6.5 hours of regular trading hours Monday through Friday. Being open 24/7 creates a market with characteristics that require strategies distinct from those of the US stock market.
Any of these can be traded The RST Way, but the implementation is a bit different. In general, this book is designed for stocks and ETFs on the US markets. Guides for options and other instruments may be shared at RocketScienceTrading.com in the future.
Day Trading Process
The American markets open at 9:30 Eastern Standard Time (EST). The market open has the most volume and volatility of the day, so that time is the primary focus for day traders. Many traders do not even consider trading after 10:30. There is tremendous demand for trading that builds up overnight while the markets are closed, which releases at the 9:30 market open. This is what creates the best opportunities for day trading in the US markets, which do not exist in 24/7 markets such as forex and crypto.
Traders typically spend 15 to 60 minutes before the market opens building their watchlist. This process involves reviewing scanner results to identify which stocks are moving with volume and volatility, then selecting the ones most likely to produce favorable trade setups. This is usually between 1 and 10 ticker symbols that the trader will enter into the trading software, so the candlestick charts and other information can be monitored for trade opportunities.
From 9:30 to 10:30, traders may take 0 to 10 trades, or more, depending on their trading style and market conditions. Then, most day traders call it a day by 10:30. Some prefer other times of day to trade, but volume and volatility drop off dramatically. Trading midday or at market closing requires different playbooks than at the market open.
Figure 2.1 shows an example of what a trader’s screen (often one of many screens) looks like. This screen displays: 1) candlestick charts representing changes in the stock’s price over time (four windows on the right), 2) “montage” window for placing orders and also viewing the Level 2 order book (upper left), 3) Time & Sales window (between montage and candlestick charts), and 4) a list of ticker symbols/watchlist (bottom left).
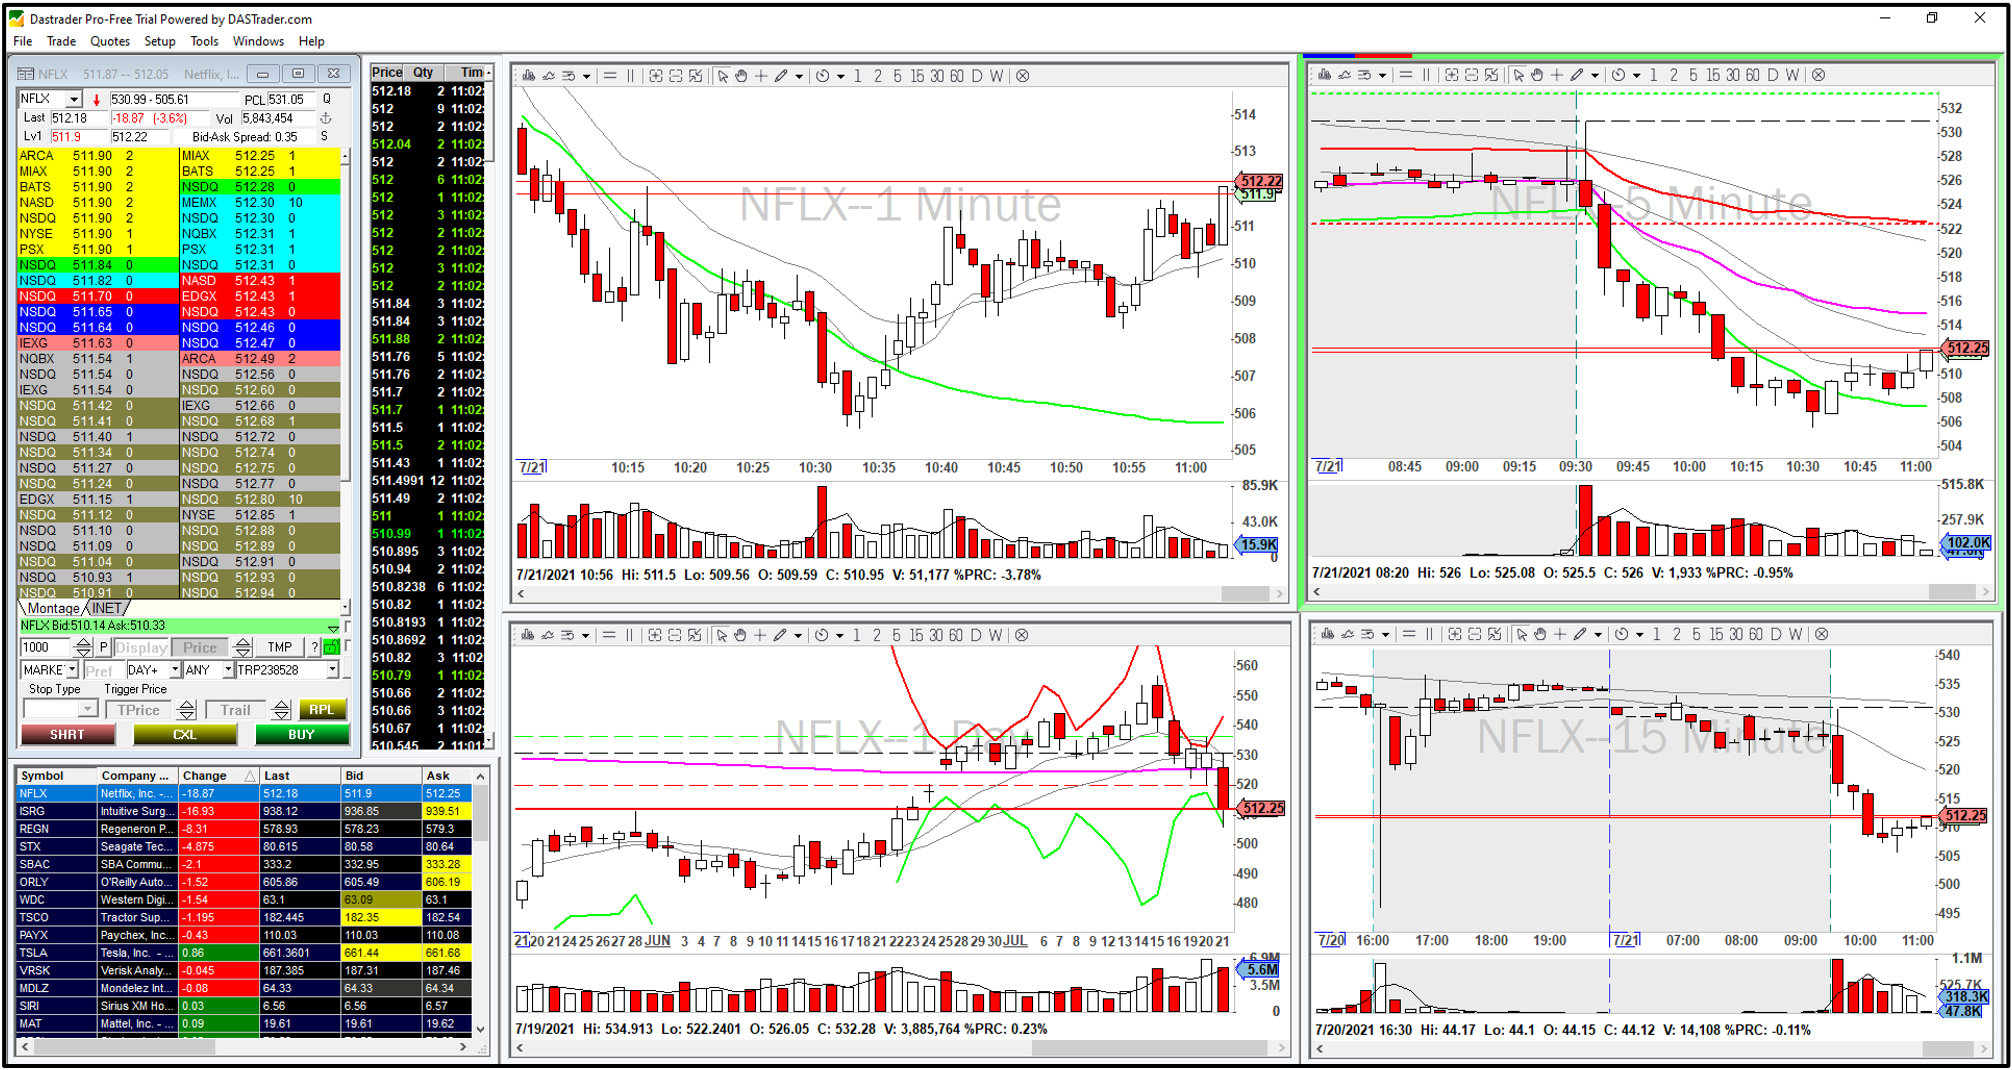
Figure 2.1. Example DAS Trader window layout.
Most traders use standard open-high-low-close (OHLC) candlestick charts, such as those shown in Figure 2.1, to find trades. These charts show the open, high, low, and close prices over a specified time frame, from 1 minute to 1 week or longer.
All traders have a trade “playbook,” or multiple playbooks, that describe the patterns/signatures they look for in these various windows. An entry in the trader’s playbook will consist of a detailed description of the candlestick pattern and other items about the stock’s price, volume, and optimal time to enter.
There are countless strategies and candlestick patterns to trade. It’s impossible to become an expert at all of them, so traders need to start with just a single playbook and master it before learning a new one. If a single playbook generates enough profit to satisfy the trader, there may be no need to add more.
While the playbook tells you how to find trades, the risk management plan tells you how to execute these trades in a way that maximizes the likelihood of profitability. Together, these are the primary components of a trading system along with the trading platform and scanner. Each can influence your trading performance.
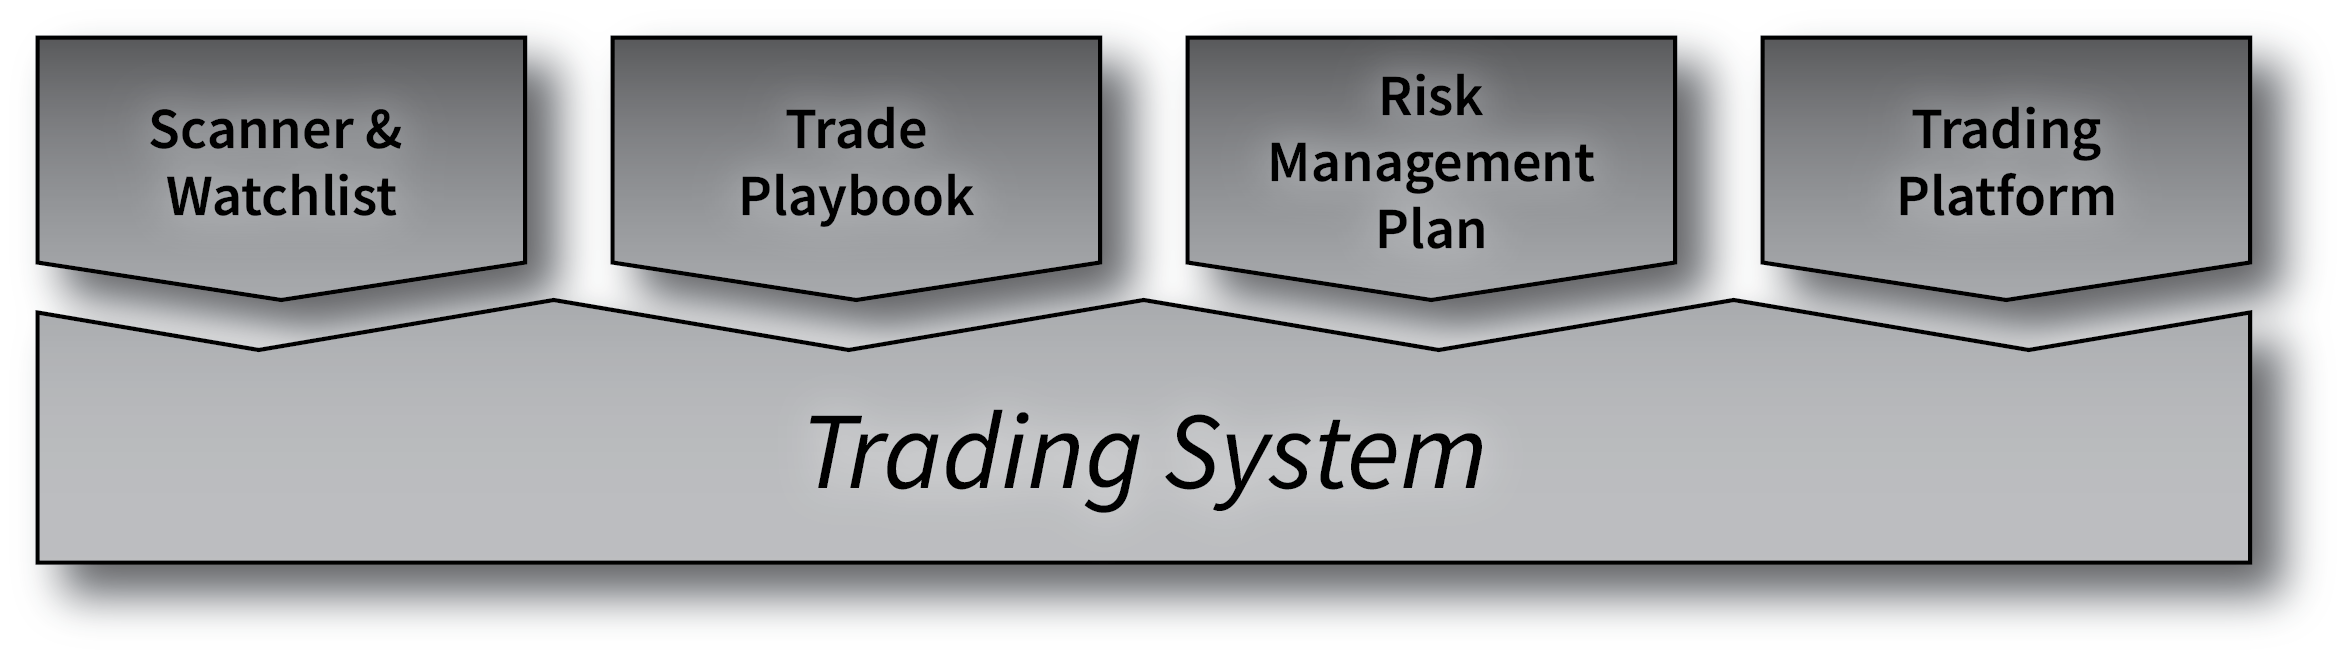
Figure 2.2. Components of a trading system.
The risk management plan dictates share size, risk/reward ratio, and exit strategy, and it helps traders distinguish between bad luck and bad trading, so they don’t inadvertently trash a million-dollar system.
The act of trading mainly involves maintaining a well-defined trade playbook and risk management plan, and taking only trades that fit those two sacred items. A large sample of trades and some basic mathematics tell us when and how to modify systems that are not working for us.
Some strategies may work for some traders and not others. The stock market is an incredibly complex and fast-moving entity. No two traders see it the same way at all times. Give two identical playbooks to two traders with the exact same trading platform, and you will get two different results. You can even have two traders enter a trade at the same time, one going long and the other short, and both have a successful trade depending on when they exit.
This is why the trade improvement process discussed at the end of the book is so important. Typical day traders cannot implement such a process because their trading systems are overly complicated and convoluted. However, The RST Way makes it dead simple to diagnose and improve trading.
An Example Day Trade
XPEV on July 1, 2021, is a good example of a trade that many day traders will look for when the market opens. XPEV was on many traders’ July 1 watchlist as it “gapped” up almost 4% overnight (Figure 2.3). The “gap” refers to the visible gap you can see on the daily candlestick chart between the current day’s open price and the previous day’s close price. XPEV closed around $44.50 on June 30 and then opened above $46 on July 1 ($1.50 gap). This is due to a price change during after-hours trading that isn’t reflected in the daily candlesticks.
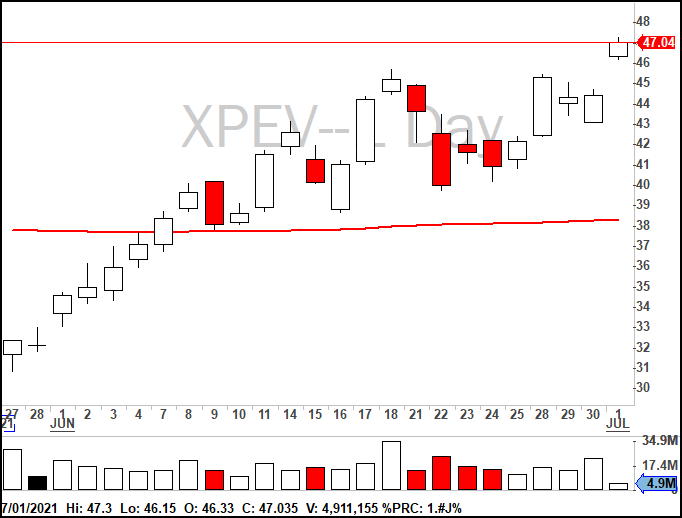
Figure 2.3. Daily chart showing overnight gap up from 6/30 close to 7/1 open.
Stocks that gap significantly overnight (by 2% or more) are prime targets for day traders. The gap often indicates company news or an event that is putting strong pressure on the stock to move up or down. This can mean very high trade volume and volatility at market open, leading to large price moves that day traders can profit from.
Figure 2.4 shows the 1-minute candlestick chart for XPEV 5 minutes after the market open (9:35). The move from $46.30 at the open to $47.30 within 4 minutes is a good example of typical price action that traders like to profit from. That $1.00 move is more than a 2% change in 4 minutes. With a modest trading account of $30,000 and a standard broker margin of 4:1, the $1.00 move, if timed perfectly, could mean a profit of more than $1,200 in just a few minutes (assuming the trader uses 50% of their trading equity to purchase 1300 shares at $46.30). That amount of profit corresponds to an account growth of 4%. That’s an astonishing amount of account growth for a four-minute trade. The S&P 500 grows at 7-8% per year. The world’s most successful hedge funds improve about 20-40% per year. Earning 4% in four minutes is quite impressive by comparison. Of course, not all trades are winners, but I hope this illustrates the types of opportunities day traders are after.
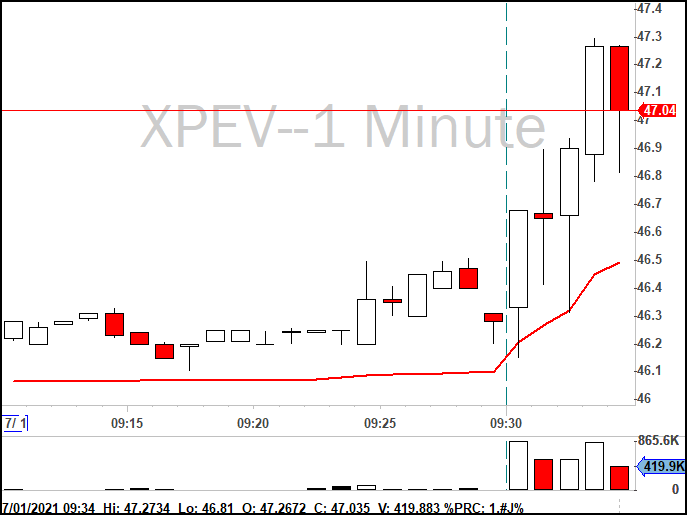
Figure 2.4. 1-minute chart for XPEV on July 1, 2021.
If you can maintain 1% growth every day for 240 trading days (one year’s worth of trading days), that is more than 1000% growth for the year. This is dramatically higher compared to the 7-40% growth of the S&P 500 and top hedge funds. This is what draws so many people to day trading. It’s a lot more work than passive investing, but the potential returns are also much higher.
Day Trading Risks
Unfortunately, returns that large are almost impossible to capture. In the previous chapter, I cited a study that found that more than 99% of day traders are unprofitable. So even just maintaining a couple of points over breakeven requires significant skill and experience. Hovering above breakeven may not sound glamorous, but it can actually make you extremely wealthy with the right approach to risk management. In chapter 7, we’ll cover the specific risks that cause 99% of day traders to fail, and in chapter 8, we’ll introduce The RST Way of trading and how it addresses those risks unlike any other trading system.